. 2025 Jul;122(26):e2419995122.
doi: 10.1073/pnas.2419995122. Epub 2025 Jun 26.

Testicular somatic and germ cell maturation during rhesus macaque development

Affiliations

Testicular somatic and germ cell maturation during rhesus macaque development

Enrique Sosa et al. Proc Natl Acad Sci U S A. 2025 Jul.

Abstract

The formation of bilateral testes in animals is critical for puberty, reproductive capacity, and testosterone production across the life course. In humans, testis development begins in embryonic life in the first trimester, with considerable effort focused on the cell and developmental events associated with testis cell specification, leaving limited knowledge on testicular organogenesis during the second and third trimesters. To fill this knowledge gap, we evaluated testicular cell maturation at weeks 5 (W5), W6, W8, W15, and W19 postconception using a rhesus macaque model. Our data identify a major transcriptional change in the somatic cells of the testis (Sertoli cells, interstitial cells and fetal Leydig cells) between W8 and W15, and this is associated with the maturation of seminiferous cords and maturation of PGCs into fetal spermatogonia. Through this work, we identified cellular changes and differential protein expression between W5 and W19 that can be used to holistically define testis development across the time course of embryonic and fetal life. This study provides important insights necessary to recreate the testicular niche from stem cells for biomedical research.

Keywords: gonadal development; rhesus macaque; single-cell RNA-seq; testicular maturation.


Conflict of interest statement

Competing interests statement:ATC is on the Board of Directors for the International Society for Stem Cell Research.

Figures
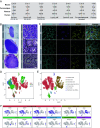
Fig. 1.
Fig. 1.
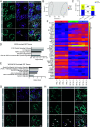
Testis development and single-cell RNA-seq in the rhesus macaque in the first, second, and third trimesters. (A) Illustration comparing the timing of selected testicular development events identified in the mouse, primates (cynomolgus or rhesus macaque), and human studies. (B) Left, Hematoxylin and Eosin (H&E) staining of embryonic and fetal testes at W8, W15, and W19. Black arrows indicate the tunica albuginea. Red arrows indicate the location of blood vessels in the tunica albuginea. (Scale bar, 100 µm); Right, High magnification images of (B) Left. Yellow dotted circles highlight the cord (W8) and tubule structures (W15, W19). (Scale bar, 20 µm). (C) Immunofluorescence staining of the testicles at time points indicated showing interstitial fibroblasts stained for NR2F2 (cyan), fetal Leydig cells stained for CYP17A1 (magenta) and Sertoli cells stained for SOX9 (yellow). Nuclei (gray) were stained with DAPI. (Scale bar, 20 µm.) (D) UMAP plot of 227,944 testicular cells revealing distinct clustering of W8 testis samples (red) relative to W15 (green) and W19 (blue) samples. (E) UMAP plot from (D) annotated with testicular cell identities reveals that Sertoli cells and interstitial cells of the rhesus testis exhibit major transcriptional differences at W8 compared to W15 and W19. Other cell types including fetal Leydig cells, endothelial cells, and immune cells and germ cells do not exhibit this type of major transcriptional shift with time (F) UMAP feature plots displaying marker gene expression for the annotation of testicular cell types identified in (E). Diagnostic genes include interstitial cells (NR2F1, NR2F1, TCF21m and DLK1), Sertoli cells (SOX9 & AMH), fetal Leydig cells (CYP17A1 and HSD3B2), germ cells (DDX4), immune cells (CD68), endothelial cells (PECAM1), and red blood cells (HEMGN). The total number of samples displayed include n = 5 biological replicates at W8, n = 4 biological replicates at W15 and n = 3 biological replicates at W19.
Fig. 2.
Fig. 2.
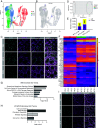
Sertoli cell identity matures between the first and second trimester. (A) IF of diagnostic Sertoli cell markers SOX9 (Cyan) and AMH (magenta) reveals stable expression in Sertoli cell cords across the three trimesters. White arrows indicate AMH-negative Sertoli cells at W19. (B) Unsupervised Multidimensional Scaling (MDS) plot of SOX9+ AMH+ Sertoli cell clusters from Fig. 1D. Each dot represents a biological replicate. W8 (red) n = 4; W15 (green) n = 4; W19 (blue) n = 3. (C) Bar graph of the number of differentially expressed genes (DEG) that are either up-regulated (yellow) or down-regulated (purple) between the compared groups as shown (FDR adjusted P value <0.05 log2 Fold change > 1). The number of DEGs is shown on the bar. The number of overlapping DEGs between comparisons is shown between the dotted lines. (D and E) Ingenuity Pathway Analysis (IPA) highlighting pathways enriched in W8 Sertoli cells but repressed in W15 and W19 (D) and pathways that become enriched in Sertoli cells as they mature from W8 to W15 and W19 (E). (F) Heat Map of log2 (normalized counts per million) of the top 20 DEG in W8 (red) compared to W15 (green) and W19 (blue) Sertoli cells. (G) IF staining of Sertoli Cells (SOX9, Cyan) confirms MYH7 (magenta) is enriched in W8 Sertoli cells but repressed with at W15 and W19. (H) IF staining for ESPN (magenta) a gene enriched with Sertoli cell (SOX9, cyan) maturation is expressed at W19 (arrows), not W8 or W15. Nuclei were detected with DAPI (gray). (Scale bar, 20 µm.) Statistics for (C) and (F) were FDR adjusted P-value < 0.05, log2FC ≥ 1.
Fig. 3.
Fig. 3.
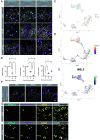
The interstitial cell identity matures between the first and second trimesters. (A) UMAP plot of NR2F2+ TCF21+ interstitial cells from SI Appendix, Fig. S4A (W8 = red, N = 4; W15 = green, N = 3; W19 = blue, N = 3). 198,449 interstitial cells analyzed. (B) UMAP features plot of (A) displaying ACTA2 [putative peritubular myoid cells (PMCs)]. (C) IF staining for the ACTA2 protein product, SMA (cyan) identifies SMA+ NR2F2+ cells surrounding the tubules. (D) Unsupervised MDS plot of interstitial cells from biological replicates at W8, W15, and W19. (E) Bar graph showing the total number of DEGs in the pair-wise comparisons shown. The number of DEGs is shown on the bar. (F) Heat Map of log2 (normalized counts per million) of the top 20 up-regulated and top 20 down-regulated DEGs at W8 (red), W15 (green), & W19 (blue). (G and H) IPA analysis of pathways enriched in the interstitial cells of first trimester testes relative to the second and third trimesters (G) and pathways enriched as interstitial cells mature in the second and third trimesters (H). (I) IF for MKi-67 (cyan) is primarily found localized to the interstitium, and not Sertoli cells (SOX9, magenta). Quantification of the IF is shown in SI Appendix, Fig. S5G. (Scale bar, 20 µm.) DAPI (gray) detects nuclei. For (E) and (H), statistics were calculated using an FDR adjusted P-value < 0.05, log2FC ≥ 1.
Fig. 4.
Fig. 4.
MSL3 marks the male rhesus macaque second trimester germline. (A) Left, IF for NANOG (cyan) and DDX4 (magenta); Center, IF for TFAP2C (cyan) and DDX4 (magenta); Right, IF for, PIWIL4 (cyan), DDX4 (magenta). (B) Quantification of the % DDX4 positive germ cells for proteins detected in (A). Quantification was performed in three sections, each 50 µm apart, under blinded conditions. (C) UMAP of the Germ Cell cluster defined in Fig. 1E (1,967 number of cells) showing a distinct cluster of W15 germ cells. (D) Pseudo time trajectory analysis on Germ cells. (E) UMAP plot of a diagnostic gene that changes with pseudotime, MSL3. (F) IF for DDX4 (magenta) with MSL3 (cyan). (G) IF for DDX4 (yellow) with NANOG/PIWIL4 (cyan) and MSL3 (magenta). Scale bar, 20 µm and nuclei are stained with DAPI (gray).
Fig. 5.
Fig. 5.
The rhesus testis originates from NR2F2+ progenitors. (A) IF staining for SOX9 (cyan) and NR2F2 (magenta) in W5 (N = 3), W6 (N = 1), and W8 (N = 5). Starting at W5, SOX9+, NR2F2 negative cells are identified in 2/3 samples. (B) AMH (magenta) expression is initiated by W6 in SOX9+ Sertoli cells. (C) CYP17A1 (magenta) a marker of fetal Leydig cells is first observed at W8 in the interstitial space. DDX4 (yellow) marks germ cells (AC). (D) SMA (cyan) a marker of PMCs is first identified at W8 in the interstitium. For AD DAPI (gray) stains nuclei and scale bar, 20 µm.

References

    1. Garcia-Alonso L., et al. , Single-cell roadmap of human gonadal development. Nature 607, 540–547 (2022). - PMC - PubMed
    1. Yasmin L., Takano J., Nagai Y., Otsuki J., Sankai T., Detection and quantification of male-specific fetal DNA in the serum of pregnant cynomolgus monkeys (Macaca fascicularis). Comp. Med. 65, 70–76 (2015). - PMC - PubMed
    1. Lucas-Herald A. K., Mitchell R. T., Testicular sertoli cell hormones in differences in sex development Front. Endocrinol. (Lausanne) 13, 919670 (2022) 10.3389/fendo.2022.919670 - DOI - PMC - PubMed
    1. Behringer R. R., Cate R. L., Froelick G. J., Palmiter R. D., Brinster R. L., Abnormal sexual development in transgenic mice chronically expressing müllerian inhibiting substance. Nature 345, 167–170 (1990). - PubMed
    1. Barker D. J., The fetal and infant origins of adult disease. BMJ 301, 1111 (1990). - PMC - PubMed

LinkOut - more resources