

Differential response of patient-derived primary glioblastoma cells to metabolic and adhesion inhibitors
- PMID: 40569470
- PMCID: PMC12202578
- DOI: 10.1007/s10238-025-01736-6
Differential response of patient-derived primary glioblastoma cells to metabolic and adhesion inhibitors
Abstract
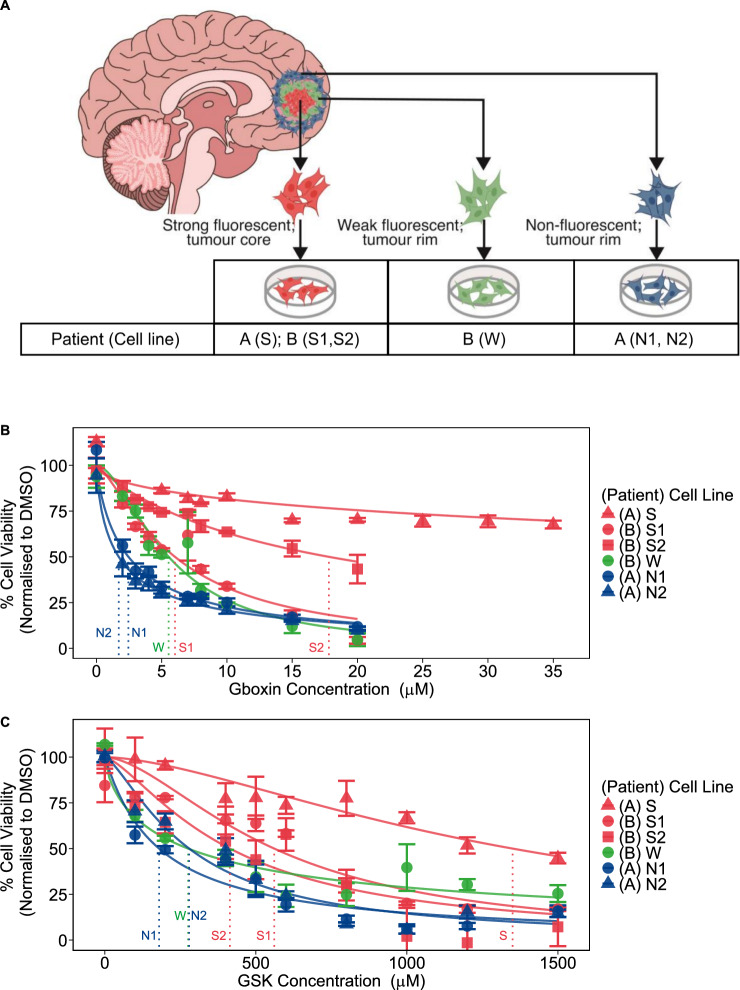
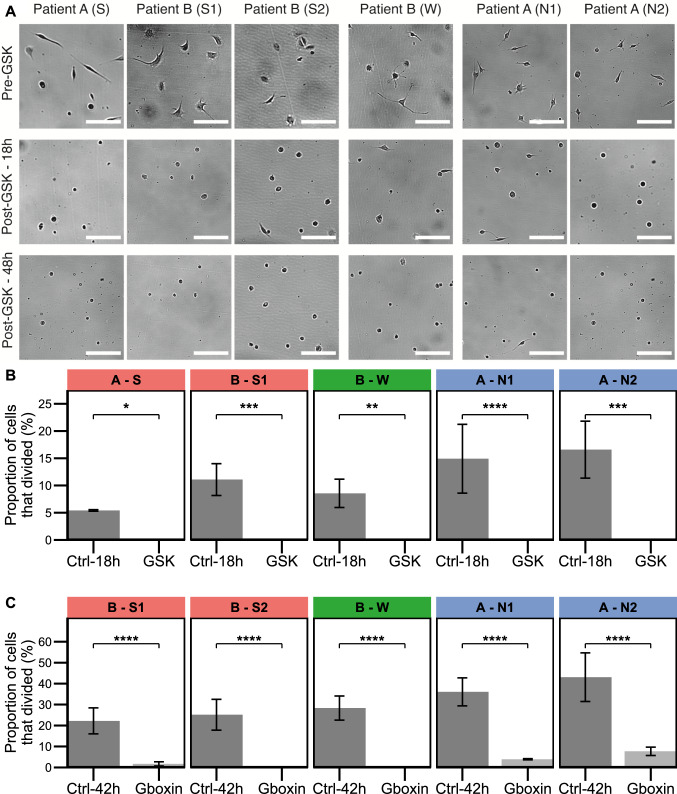
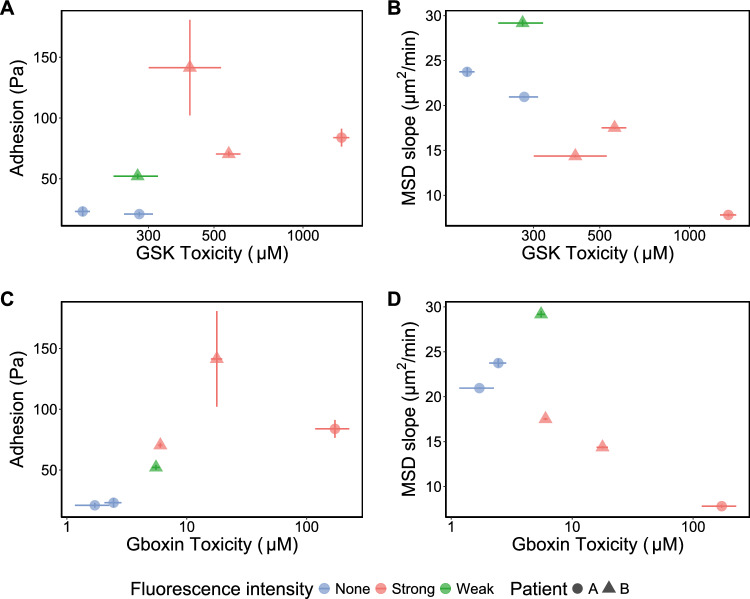
This study aims to investigate the cellular response of Glioblastoma (GBM) to adhesion and metabolic inhibitors, focusing on cell migration and matrix adhesion properties. GBM is the most common incurable brain tumor. Despite decades of research into GBM's chemical and molecular classification, identifying mechanisms of drug resistance has been challenging. Studies on inhibitors targeting cancer cell migration and proliferation rarely consider the heterogeneous migration properties among cells, which may impact patient responses to treatment. In this work, tissue samples were obtained from spatially distinct locations with different 5-aminolevulinic acid (5-ALA) fluorescent intensities-including strongly fluorescent tumor cores, a weakly fluorescent tumor rim, and non-fluorescent tumor margins. These samples were previously shown to be associated with significantly different motility and adhesion properties. We tested the response of tumor cells to adhesion and metabolic inhibitors using metabolic MTT and Cell Titer Glo viability assays, respectively. We also monitored cell survival using time-lapse microscopy, while culturing them on low-modulus polydimethylsiloxane (representing the stiffness of brain tissue). Metabolic viability assays revealed substantial heterogeneity in drug potency across cells from different regions of the tumor. Highly fluorescent tumor core cells were significantly more resistant to an F0F1 ATP synthase inhibitor (Gboxin), and a FAK inhibitor (GSK2256098), while their proliferation ceased post-treatment in vitro. In contrast, cells derived from non-fluorescent tumor margins exhibited higher potency for the ATP synthase inhibitor (Gboxin), but their proliferation persisted post-treatment. Our study demonstrates a correlation between the adhesive and migration properties of cells and their sensitivity to therapeutics in different regions of the tumor within individual patients and between patients with GBM.
Keywords: Drug discovery; Glioblastoma; Mechanobiology.
© 2025. The Author(s).
Conflict of interest statement
Declarations. Conflict of interests: The authors report no conflict of interest, and the present study has not been presented elsewhere. Ethical approval: Tissue collection protocols complied with the UK Human Tissue Act 2004 (HTA license ref. 12315) and were approved by the local regional ethics committee (LREC ref. 04/Q0108/60) on 28.06.2004 and approval renewed 08.07.2011. Consent to participate: Informed consent was obtained from all subjects involved in the study. Consent to publication: Not applicable.
Figures
Similar articles
-
Treatment options for progression or recurrence of glioblastoma: a network meta-analysis.Cochrane Database Syst Rev. 2021 May 4;5(1):CD013579. doi: 10.1002/14651858.CD013579.pub2. Cochrane Database Syst Rev. 2021. PMID: 34559423 Free PMC article.
-
A rapid and systematic review of the clinical effectiveness and cost-effectiveness of paclitaxel, docetaxel, gemcitabine and vinorelbine in non-small-cell lung cancer.Health Technol Assess. 2001;5(32):1-195. doi: 10.3310/hta5320. Health Technol Assess. 2001. PMID: 12065068
-
Systemic pharmacological treatments for chronic plaque psoriasis: a network meta-analysis.Cochrane Database Syst Rev. 2021 Apr 19;4(4):CD011535. doi: 10.1002/14651858.CD011535.pub4. Cochrane Database Syst Rev. 2021. Update in: Cochrane Database Syst Rev. 2022 May 23;5:CD011535. doi: 10.1002/14651858.CD011535.pub5. PMID: 33871055 Free PMC article. Updated.
-
Autophagy modulates glioblastoma cell sensitivity to Selinexor-mediated XPO1 inhibition.Neuro Oncol. 2025 Jun 21;27(5):1210-1226. doi: 10.1093/neuonc/noae280. Neuro Oncol. 2025. PMID: 39731209 Free PMC article.
-
Systemic pharmacological treatments for chronic plaque psoriasis: a network meta-analysis.Cochrane Database Syst Rev. 2017 Dec 22;12(12):CD011535. doi: 10.1002/14651858.CD011535.pub2. Cochrane Database Syst Rev. 2017. Update in: Cochrane Database Syst Rev. 2020 Jan 9;1:CD011535. doi: 10.1002/14651858.CD011535.pub3. PMID: 29271481 Free PMC article. Updated.
References
-
- Almiron Bonnin DA, Havrda MC, Lee MC, Evans L, Ran C, Qian DC, et al. Characterizing the heterogeneity in 5-aminolevulinic acid-induced fluorescence in glioblastoma. J Neurosurg. 2019;132(6):1706–14. - PubMed
-
- Foss A, Young So W, Gottesman MM, Tanner K. Patient-derived glioblastoma (GBM) cells exhibit distinct rheological profiles associated with altered cytoskeleton regulation. Biophys J. 2021;120(3):192a.
MeSH terms
Substances
LinkOut - more resources
Full Text Sources
Medical
Miscellaneous
