

Metabolomic profiling of renal cyst fluid in advanced ADPKD: insights from dialysis and transplantation cohorts
- PMID: 40569531
- PMCID: PMC12202516
- DOI: 10.1007/s11306-025-02291-7
Metabolomic profiling of renal cyst fluid in advanced ADPKD: insights from dialysis and transplantation cohorts
Abstract
Background: Autosomal dominant polycystic kidney disease (ADPKD) is the most common hereditary kidney disorder characterized by progressive renal cyst formation, often leading to end-stage kidney disease (ESKD). In contrast to the urinary metabolome in ADPKD, the composition of renal cyst fluid remains largely unexplored.
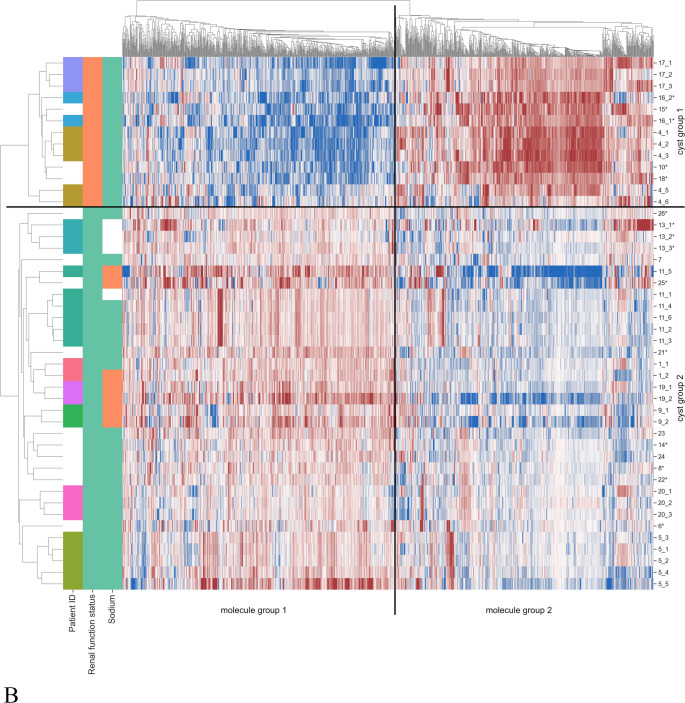
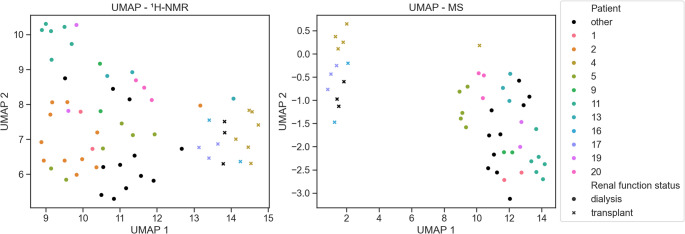
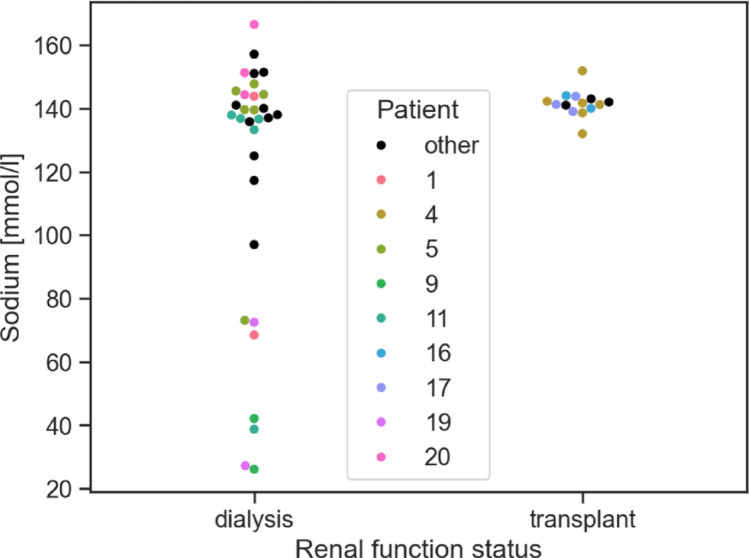
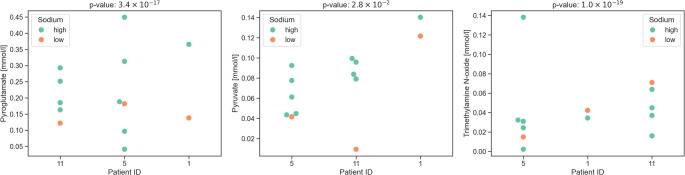
Methods: We conducted a comprehensive metabolomic analysis of renal cyst fluid from 26 ADPKD patients (20 on dialysis, six with kidney transplants) using ¹H-NMR spectroscopy and liquid chromatography-mass spectrometry (LC-MS). Cysts were clustered based on metabolite profiles, and differences were analyzed across groups defined by renal function status (dialysis vs. transplant), cyst volume, and cyst fluid sodium concentrations.
Results: Dialysis patients and transplant recipients differed significantly in their renal cyst fluid metabolomes. The former exhibited higher concentrations of myoinositol, creatinine, sucrose, τ-methylhistidine, trigonelline, and sarcosine, while the latter showed increased levels of leucine, isoleucine, valine and alanine. Remarkably, metabolites of the immunosuppressive prodrug mycophenolate mofetil were detected in renal cyst fluids after kidney transplantation. Despite intra- and interindividual variability, cyst fluid from the same patient displayed greater homogeneity. Interestingly, metabolomic profiles were not altered by cyst size.
Conclusion: This first systematic metabolomic analysis of renal cyst fluid in advanced ADPKD reveals distinct metabolic signatures linked to renal function status. The data provides novel insights into the pathophysiology of ADPKD and highlight the potentials of renal cyst fluid metabolomics for identifying biomarkers and therapeutic targets.
Keywords: ADPKD; Cyst fluid; Mass spectrometry; Metabolomics; NMR spectroscopy; Patient clustering.
© 2025. The Author(s).
Conflict of interest statement
Declarations. Conflict of interest: The authors declare no competing interests. Ethics approval and consent to participate: Informed consent was obtained from all subjects and/or their legal guardians and experiments were approved by the ethics committee of the University of Regensburg (no. 20-1886-101) and of the Friedrich-Alexander-University Erlangen-Nuremberg (no. 23-404-Bn). All patient data gets encrypted, and every patient gets an internal patient ID. All data protection guidelines from the University of Regensburg are met. Consent for publication: All authors agree with the publication of this manuscript.
Figures

References
-
- Al Khunaizi, A., & Alam, A. (2018). End-Stage Renal Disease in Patients with Autosomal Dominant Polycystic Kidney Disease. In: Benjamin D. Cowley, JR und John J. Bissler (Hg.) Polycystic Kidney Disease: Translating Mechanisms into Therapy. New York, NY: Springer New York, S. 229–241.
-
- Aouad, H., Faucher, Q., Sauvage, F. L., Pinault, E., Barrot, C. C., Arnion, H., et al. (2023). A multi-omics investigation of tacrolimus off-target effects on a proximal tubule cell-line. Pharmacological Research, 192, 106794. 10.1016/j.phrs.2023.106794 - PubMed
MeSH terms
LinkOut - more resources
Full Text Sources
Medical