. 2025 Aug;12(31):e2405860.
doi: 10.1002/advs.202405860. Epub 2025 Jun 26.

Multivariate Screening and Automated Clustering of Macrophage Immunoreactome to Nanoparticles and Photothermal Therapy

Affiliations

Multivariate Screening and Automated Clustering of Macrophage Immunoreactome to Nanoparticles and Photothermal Therapy

Sonia Becharef et al. Adv Sci (Weinh). 2025 Aug.

Abstract

Immunotherapy aims to control the immune system against diseases such as cancer or infections. Nanotechnology is part of the armamentarium to reprogram the immune system in a spatially and temporally controlled manner. However, predicting immune responses using high-throughput tests is challenging due to the immunoreactome's complexity and plasticity. This work presents a fast, machine learning-assisted predictive assay to classify the multifactorial immune responses to any kind of treatments. Engineered human THP-1 monocytes differentiated and polarized into M0, M1, and M2 macrophages are used to monitor nuclear factor Kappa B (NF-kB) and interferon regulatory factor (IRF) pathway activations and gene expression profile in response to metallic nanoparticles (NPs), activated or not by light to induce photothermal therapy (PTT). Principal component analysis (PCA) reveals distinct responses to nanoparticles and the reprogramming toward inflammatory macrophage triggered by PTT. Gold-iron oxide nanoflowers and magnetosomes per se favor polarization toward M2 profile, while light activation shifts this M2-like macrophages toward an M1 phenotype. These findings, confirmed on human blood derived monocytes shed light on the intricate immunomodulatory effects of nanoparticles and PTT on macrophage behavior and provide a basis for an adaptable screening method for the predictive design of therapeutic strategies for immunotherapy in cancer and other diseases.

Keywords: immunotherapy; macrophages; nanoparticles; photothermal therapy.


Conflict of interest statement

The remaining authors declare that the research was conducted in the absence of any commercial or financial relationships that could be construed as a potential conflict of interest.

Figures

Scheme 1
Scheme 1
Schematic illustration of a screening test platform to predict the effects of different treatments on macrophage polarization and inflammation in vitro. PMA: phorbol 12‐myristate 13‐acetate; Dexa: dexamethasone; IRF: interferon regulatory factor pathway; NF‐κB: nuclear factor kappa B pathway; SEAP: secreted embryonic alkaline phosphatase. QB: QUANTI‐Blue, QL: QUANTI‐Luc, TLR: toll‐like receptor; NPs: nanoparticle, ISRE: interferon stimulated response element. Scheme created with BioRender.com.
Figure 1
Figure 1
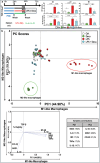
Validation of the differentiation and polarization protocol on THP‐1 Dual cell line. a) Protocol of polarization used. b) Relative mRNA expression of M1 and M2 macrophage markers was assessed in monocytes and M0, M1, and M2 macrophages using qPCR. Analysis was conducted on untreated samples and normalized to the RPLP0 housekeeping gene. Results are presented as foldchange based on monocytes and expressed as mean ± SD. N = 3. c) Quantification of human proinflammatory cytokines using MSD multiplex ELISA. Samples were collected from supernatant of THP‐1 Dual monocyte and differentiated macrophages into M0, M1, and M2 after 48 h in culture. d) NF‐κB and IRF activation of THP‐1 Dual monocytes and macrophages. NF‐κB and IRF signaling pathways were quantified using QUANTI‐Luc and QUANTI‐Blue, respectively. Data were normalized into foldchange based on M0 macrophages. e) The principal component analysis (PCA) was carried out on differentiated macrophages, utilizing the methodology described in this study and based on data from b and d. qPCR and pathway activation data were normalized on M0 macrophages. PCA automatically identified three distinct clusters representing M0, M1, and M2 differentiated macrophages (shows as 0, 1, and 2, respectively on the PCA scatter plot (PC scores, left)), thereby validating the reliability of our differentiation protocol. The loading plot (right) refers to the contributions of the different features into the two first PCs. The contributions are detailed in the variable contributions table. The percentage next to the PCs axis represents the percentage of the total variance of the data explained by each principal component individually. Results are shown as the mean ± SD, N = 3. Results of univariate statistical analysis are illustrated by * p < 0.05, ** p < 0.01, or *** p < 0.001.
Figure 2
Figure 2
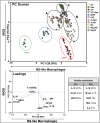
a) Polarization protocol employed, and control treatments used to modulate macrophage polarization and NF‐κB or IRF activity. The macrophages were treated with two different agents: Lipopolysaccharide (LPS), which acts as an inflammatory agent, triggering Toll‐like receptors (TLRs) and prompting a proinflammatory response; dexamethasone, which was used as an anti‐inflammatory control. Combination of LPS and dexamethasone was used to evaluate the protective effects of dexamethasone against inflammation. b) PCA was carried out to uncover the immunomodulatory effects of differentiated macrophages, with these additional control treatments considered for examination. Scatter plot (PC scores, top) exhibited three clusters, two of them corresponding to extremely polarized macrophages (i.e., M1 macrophages treated with LPS and M2 macrophages treated with Dexa). The third cluster regroup controls and macrophages treated with inflammatory agent inducing opposing effect to the polarization. The loading plot (bottom) refers to the contributions of the different features into the two first PCs. The contributions are detailed in the variable contributions table. Results of univariate statistical analysis are illustrated by * p < 0.05, ** p < 0.01, or *** p < 0.001.
Figure 3
Figure 3
Description of NPs used in this study. Gold‐decorated Iron Oxide Nanoflowers (GIONF) consist of citrate‐coated 20 nm multicore iron oxide nanoflowers (IONF) decorated with 2–5 nm gold NPs coated with dithiolated diethylenetriamine pentaacetic acid (DTDTPA). Sodium aurothiomalate was used to treat THP‐1 Dual derived M0 macrophages resulting in the formation of intralysosomal nanoassemblies of tiny gold 2 nm nanoclusters, forming curved lashes, also called aurosomes. RCL NPs are multicore magnetic plates embedded in a dextran (H(C6H10O5)xOH) 40 kDa matrix. Magnetosomes isolated from magnetotactic bacteria were coated with carboxymethyl dextran (CMD) or citric acid (CA). Transmission electron microscopy (TEM) was employed to obtain images of the NPs deposited on the grid. In case of Au salts, TEM pictures show 70 nm slices of THP‐1 macrophages (M0) treated with Au salts for 24 h and embedded in resin. The size distribution of each type of nanostructures has been quantified from TEM pictures and is shown in Figure S6 (Supporting Information).
Figure 4
Figure 4
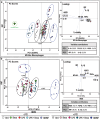
PCA was conducted on M0, M1, and M2 macrophages and exposed to various nanoparticles (NPs) and Au salts. LPS and Dexamethasone was used as pro and anti‐inflammatory control respectively. The figure presents scatter plot (PC scores, top) showing six clusters. The loading plot (bottom) refers to the contributions of the different features into the two first PCs. The contributions are detailed in the variable contributions table.
Figure 5
Figure 5
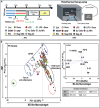
a) Protocol for polarization was employed with and without photothermal therapy (PTT), utilizing a PTT session at 808 nm for 10 min at a power density of 1 W cm 2. b) The two PCA graphs illustrate the impact of various nanoparticles (NPs) on macrophage polarization and inflammation status, with and without PTT activation.
Figure 6
Figure 6
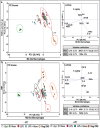
PCA of the immunomodulatory properties of GIONFs with and without PTT. a) Scatter plot of PC3 versus PC1, b) Scatter plot of PC3 versus PC2.
Figure 7
Figure 7
PCA of the immunomodulatory properties of magnetosomes CMD with and without PTT. a) Scatter plot of PC2 versus PC1, b) scatter plot of PC4 versus PC1.
Figure 8
Figure 8
PCA of the immunomodulatory properties of gold salt treatment with and without PTT. Scatter plot of PC2 versus PC1.
Figure 9
Figure 9
The PCA analysis illustrates the immunomodulatory properties of GIONFs, with and without laser exposure (PTT) on macrophages derived from human blood monocytes. Macrophages treated with GIONFs alone are represented in light blue, while the addition of PTT (dark blue) drives a shift in macrophage polarization from an M2‐like profile to an M1‐like profile, as indicated by a transition from the left to the right along the x‐axis. The experiments were performed using samples from four different donors (N = 4), with duplicates for each donor.
Figure 10
Figure 10
The PCA analysis highlights the immunomodulatory properties of CMD magnetosomes, with and without laser exposure (PTT), on macrophages derived from human blood monocytes. Macrophages treated with CMD magnetosomes alone (light orange) exhibit a shift from an M1‐like to an M2‐like polarization. In contrast, the addition of PTT (dark orange) shifts the macrophages to a more pronounced M1‐like profile. The experiments were performed using samples from four different donors (N = 4), with duplicates for each donor.

References

    1. Li J., Lu W., Yang Y., Xiang R., Ling Y., Yu C., Zhou Y., Adv. Sci. 2023, 10, 2204932. - PMC - PubMed
    1. Chen Y., J. Controlled Release 2023, 356, 14. - PubMed
    1. Liu Y., Xu D., Liu Y., Zheng X., Zang J., Ye W., Zhao Y., He R., Ruan S., Zhang T., Dong H., Li Y., Li Y., Biomaterials 2022, 284, 121516. - PubMed
    1. Gao S., Yang X., Xu J., Qiu N., Zhai G., ACS Nano 2021, 15, 12567. - PubMed
    1. Rostam H. M., Reynolds P. M., Alexander M. R., Gadegaard N., Ghaemmaghami A. M., Sci. Rep. 2017, 7, 3521. - PMC - PubMed

LinkOut - more resources