

Two Worlds on a Stone: Arctic Desert Hypoliths and Epiliths Show Spatial Niche Differentiation
- PMID: 40569605
- PMCID: PMC12199873
- DOI: 10.1111/gbi.70025
Two Worlds on a Stone: Arctic Desert Hypoliths and Epiliths Show Spatial Niche Differentiation
Abstract
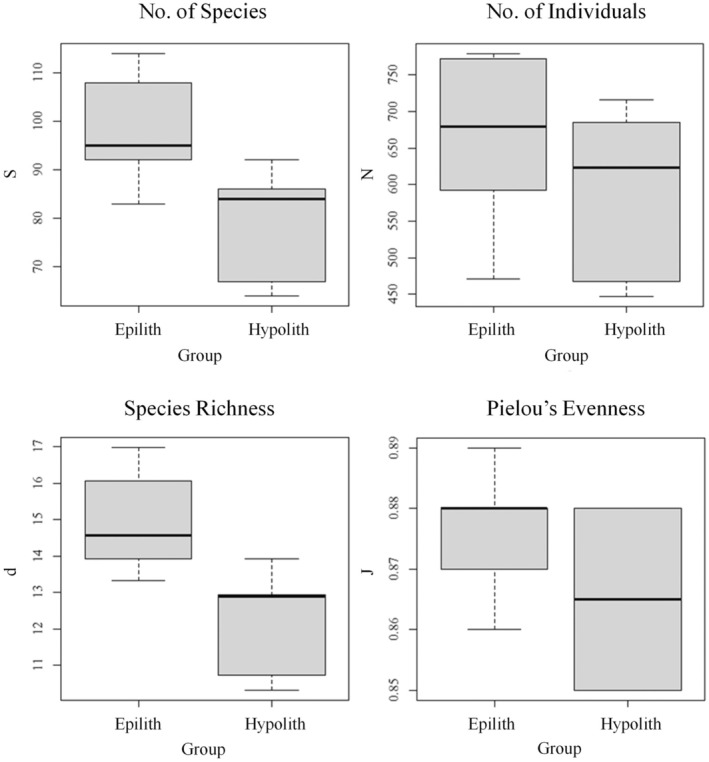
In Arctic polar deserts, rocks can be extensively colonized by phototrophic hypolithic communities that exploit periglacial sorting processes to grow beneath opaque rocks. These communities are distinguished by green bands that are distinctly and abruptly separated from the black-pigmented communities on the rock surface (epiliths). We used 16S and 18S rDNA culture-independent methods to address the hypothesis that the two communities are different. Although both communities were dominated by cyanobacterial species (Chroococcidiopsis and Nostoc spp.), we found that the hypolithic and epilithic habitats host distinct microbial communities. We found that eukaryotic hypolithic and epilithic communities were statistically similar but that the hypolithic habitats contained tardigrade DNA, showing that the more clement subsurface habitat supports animal life in contrast to the surface of the rocks. These results reveal the distinctive communities and sharp demarcations that can develop across small spatial scales in the Earth's rocky extreme environments.
© 2025 The Author(s). Geobiology published by John Wiley & Sons Ltd.
Conflict of interest statement
The authors declare no conflicts of interest.
Figures


Similar articles
-
Life on the rocks: polyphasic evaluation of three epilithic cyanobacterial strains isolated from a single rock, with the description of Nostoc sikkimense sp. nov., from the northeastern region of India.FEMS Microbiol Lett. 2025 Jan 10;372:fnaf037. doi: 10.1093/femsle/fnaf037. FEMS Microbiol Lett. 2025. PMID: 40180585
-
Biosignatures of diverse eukaryotic life from a Snowball Earth analogue environment in Antarctica.Nat Commun. 2025 Jun 19;16(1):5315. doi: 10.1038/s41467-025-60713-5. Nat Commun. 2025. PMID: 40537504 Free PMC article.
-
Chemoautotrophy in subzero environments and the potential for cold-adapted Rubisco.Appl Environ Microbiol. 2025 Jun 18;91(6):e0060425. doi: 10.1128/aem.00604-25. Epub 2025 May 30. Appl Environ Microbiol. 2025. PMID: 40444981 Free PMC article.
-
Behavioral interventions to reduce risk for sexual transmission of HIV among men who have sex with men.Cochrane Database Syst Rev. 2008 Jul 16;(3):CD001230. doi: 10.1002/14651858.CD001230.pub2. Cochrane Database Syst Rev. 2008. PMID: 18646068
-
Comparison of cellulose, modified cellulose and synthetic membranes in the haemodialysis of patients with end-stage renal disease.Cochrane Database Syst Rev. 2001;(3):CD003234. doi: 10.1002/14651858.CD003234. Cochrane Database Syst Rev. 2001. Update in: Cochrane Database Syst Rev. 2005 Jul 20;(3):CD003234. doi: 10.1002/14651858.CD003234.pub2. PMID: 11687058 Updated.
References
-
- Baqué, M. , de Vera J.‐P., Rettberg P., and Billi D.. 2013. “The BOSS and BIOMEX Space Experiments on the EXPOSE‐R2 Mission: Endurance of the Desert Cyanobacterium Chroococcidiopsis Under Simulated Space Vacuum, Martian Atmosphere, UVC Radiation and Temperature Extremes.” Acta Astronautica 91: 180–186.
-
- Beals, E. W. 1984. “Advances in Ecological Research.” In Bray‐Curtis Ordination: An Effective Strategy for Analysis of Multivariate Ecological Data, 1–55. Elsevier.
-
- Berner, T. , and Evenari M.. 1978. “The Influence of Temperature and Light Penetration on the Abundance of the Hypolithic Algae in the Negev Desert of Israel.” Oecologia 33: 255–260. - PubMed
MeSH terms
Substances
Grants and funding
LinkOut - more resources
Full Text Sources
Miscellaneous
