Review
. 2025 Jun;28(6):e70161.
doi: 10.1111/ele.70161.

Deciphering Probabilistic Species Interaction Networks

Affiliations
Review

Deciphering Probabilistic Species Interaction Networks

Francis Banville et al. Ecol Lett. 2025 Jun.

Abstract

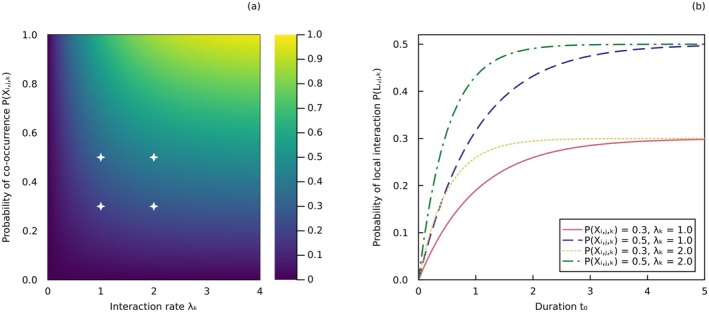
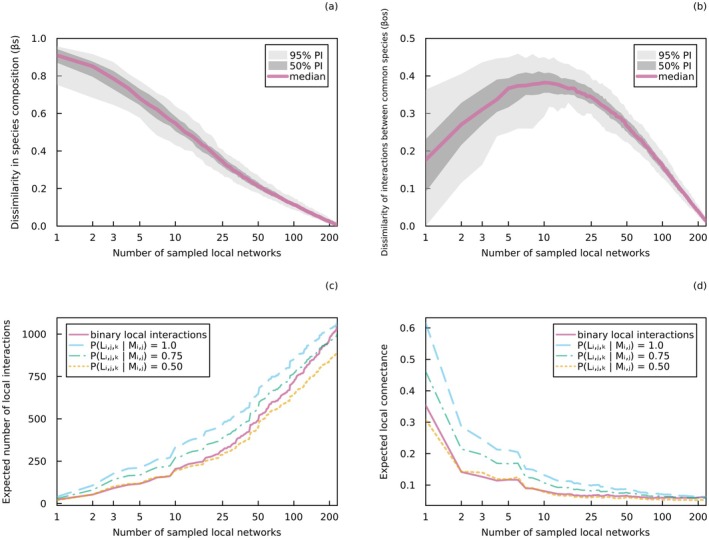
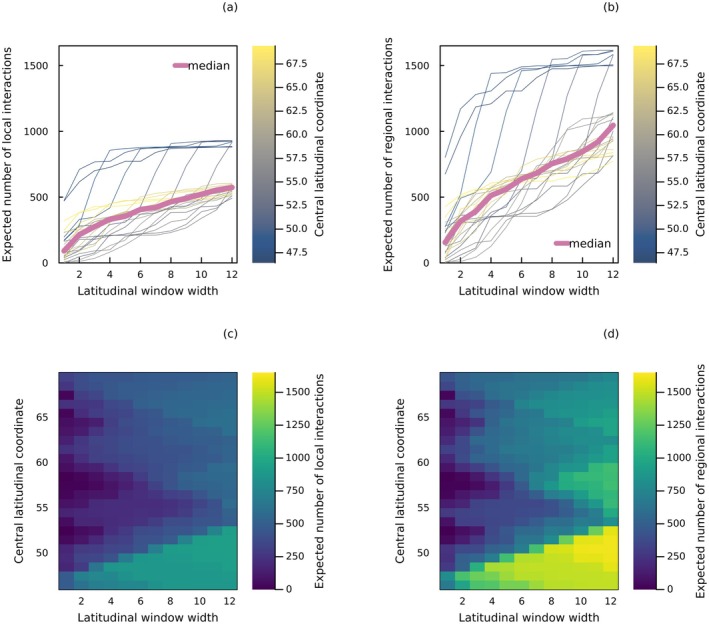
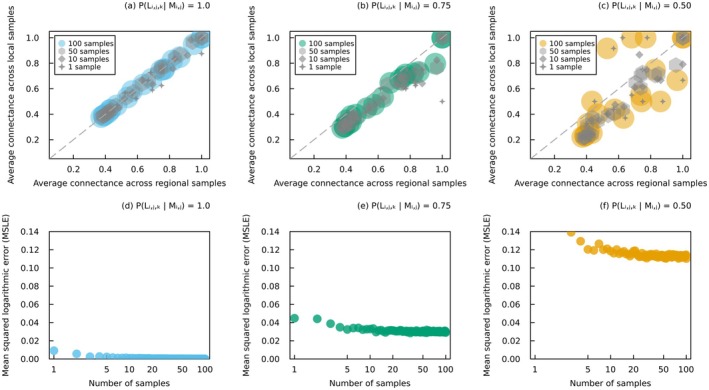
Representing species interactions probabilistically as opposed to deterministically conveys uncertainties in our knowledge of interactions. The sources of uncertainty captured by interaction probabilities depend on the method used to evaluate them: uncertainty of predictive models, subjective assessment of experts, or empirical measurement of interaction spatiotemporal variability. However, guidelines for the estimation and documentation of probabilistic interaction data are lacking. This is concerning because our understanding of interaction probabilities depend on their sometimes elusive definition and uncertainty sources. We review how probabilistic interactions are defined at different spatial scales. These definitions are based on the distinction between the realisation of an interaction at a specific time and space (local networks) and its biological or ecological feasibility (metaweb). Using host-parasite interactions in Europe, we illustrate how these two network representations differ in their statistical properties, specifically: how local networks and metawebs differ in their spatial and temporal scaling of interactions. We present two approaches to inferring binary interactions from probabilistic ones that account for these differences and show that systematic biases arise when directly inferring local networks from metawebs. Our results underscore the importance of more rigorous descriptions of probabilistic species interactions that specify their conditional variables and uncertainty sources.

Keywords: ecological modelling; ecological networks; food webs; host–parasite interactions; metaweb; sampling; spatial scale; species interactions; temporal scale; uncertainty.


Figures

FIGURE 1
FIGURE 1
Parameters of the spatiotemporally explicit model of interactions. (a) Probability of local interaction φi,j,k=PLi,j,k (short for PLi,j,k=1) given by the process model (Equation (15), Box 1) under different values of λi,j,k (interaction rate) and PXi,j,k (probability of co‐occurrence, short for PXi,j,k=1), with t0=1 (duration). The probability of local interaction represents the probability that the two taxa will interact at least once within the given time interval. Parameters t0 and λi,j,k have complementary units (e.g., t0 in months and λi,j,k in number of interactions per month). The parameter values used in the right panel are denoted by the white stars. (b) Scaling of the probability of interaction with the duration parameter t0, for different values of λi,j,k and PXi,j,k.
FIGURE 2
FIGURE 2
Network accumulation curves. (a) Dissimilarity in species composition and (b) dissimilarity of interactions between common species between aggregated local networks and the metaweb of binary host–parasite interactions. In both panels, the coloured line represents the median dissimilarity across simulations and the grey areas cover the 50% and 95% percentile intervals. (c) Scaling of the number of interactions and (d) scaling of connectance with the number of sampled (aggregated) binary and probabilistic local interaction networks. For a better comparison with binary interactions, local networks of probabilistic interactions were derived from a metaweb of probabilistic interactions with a false positive and false negative rate of zero. A specific value of PLi,j,k|Mi,j (the local probability of interaction among potentially interacting species) was used for all non‐aggregated local networks within a particular curve. Aggregated local networks were obtained by sequentially and randomly selecting a number of local networks and aggregating both their species and interactions (with the value of PLi,j,k|Mi,j increasing in aggregated local networks of probabilistic interactions). All data are from Kopelke et al. (2017), and more details on the analysis can be found in Box 2 and Data S1.
FIGURE 3
FIGURE 3
Spatial scaling of interactions. Expected number of host–parasite interactions in a network aggregating all (a) local and (b) regional probabilistic interactions within a latitudinal window of a given width. Every dashed curve corresponds to a different window centered at a given latitude (colour bar), with the pink solid line representing the median number of interactions across windows. Heatmaps of the expected number of (c) local and (d) regional interactions found in windows of specified width and position (central latitude). Probabilities of regional interactions were obtained with a false positive rate of 5% and a false negative rate of 10%. Local probabilistic interactions were derived from regional probabilistic interactions by setting the value of PLi,j,k|Mi,j (the local probability of interaction among potentially interacting species) to 1. Aggregated local networks were obtained by aggregating both the species and interactions found within a particular latitudinal window, with the values of PLi,j,k|Mi,j remaining at their maximum value of 1. All data are from Kopelke et al. (2017), and more details on the analysis can be found in Box 3 and Data S1.
FIGURE 4
FIGURE 4
Connectance of sampled binary interaction networks. (a–c) Average connectance of binary interaction networks obtained from the two sampling techniques for 20 randomly selected host–parasite networks. Cross markers represent the connectance of a single sample for each network, diamond markers the average connectance across 10 samples, hexagon markers the average connectance across 50 samples, and the coloured circles the average connectance across 100 samples (marker size proportional to the number of samples). (d‐f) Reduction in the mean squared logarithmic error between the average connectance of binary interaction networks (all 233 host–parasite networks) obtained from these two sampling techniques as the number of samples increases. The local probability of interaction between potentially interacting species was set to three different values: (a, d) PLi,j,k|Mi,j=1.0, (b, e) PLi,j,k|Mi,j=0.75, and (c, f) PLi,j,k|Mi,j=0.50. Probabilities of regional interactions were obtained with a false positive rate of 5% and a false negative rate of 10%. Regional samples were obtained by randomly sampling binary interactions from the probabilistic interaction metaweb, and then propagating this result to all local networks that include the species potentially engaged in the interactions. Local samples were obtained by independently sampling binary interactions for each local network of probabilistic interactions. All data are from Kopelke et al. (2017), and more details on the analysis can be found in Box 5 and Data S1.

Similar articles

References

    1. Abrego, N. , Roslin T., Huotari T., et al. 2021. “Accounting for Species Interactions Is Necessary for Predicting How Arctic Arthropod Communities Respond to Climate Change.” Ecography 44, no. 6: 885–896.
    1. Aguiar, L. M. S. , Diniz U. M., Bueno‐Rocha I. D., et al. 2024. “Untangling Biodiversity Interactions: A Meta Network on Pollination in Earth's Most Diverse Tropical Savanna.” Ecology and Evolution 14, no. 3: e11094. - PMC - PubMed
    1. Angilletta, M. J., Jr. , Steury T. D., and Sears M. W.. 2004. “Temperature, Growth Rate, and Body Size in Ectotherms: Fitting Pieces of a Life‐History Puzzle1.” Integrative and Comparative Biology 44, no. 6: 498–509. - PubMed
    1. Araujo, M. B. , Rozenfeld A., Rahbek C., and Marquet P. A.. 2011. “Using Species Co‐Occurrence Networks to Assess the Impacts of Climate Change.” Ecography 34, no. 6: 897–908.
    1. Bartomeus, I. , Gravel D., Tylianakis J. M., Aizen M. A., Dickie I. A., and Bernard‐Verdier M.. 2016. “A Common Framework for Identifying Linkage Rules Across Different Types of Interactions.” Functional Ecology 30, no. 12: 1894–1903.

LinkOut - more resources