

Effect of the exposure to brominated flame retardants on hyperuricemia using interpretable machine learning algorithms based on the SHAP methodology
- PMID: 40570004
- PMCID: PMC12200863
- DOI: 10.1371/journal.pone.0325896
Effect of the exposure to brominated flame retardants on hyperuricemia using interpretable machine learning algorithms based on the SHAP methodology
Abstract
Background: Brominated flame retardants (BFRs) are classified as important endocrine disruptors and persistent organic pollutants; nevertheless, there is no comprehensive investigation to evaluate the association between BFRs and hyperuricemia, and the available studies related to this field are exceptionally scarce.
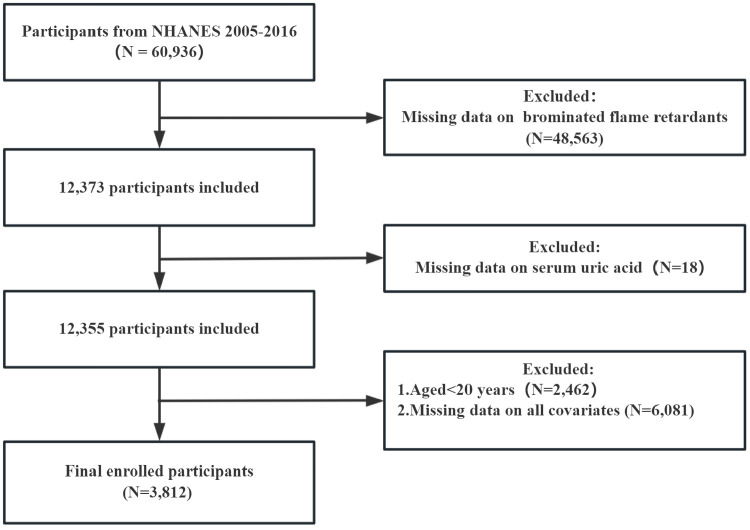
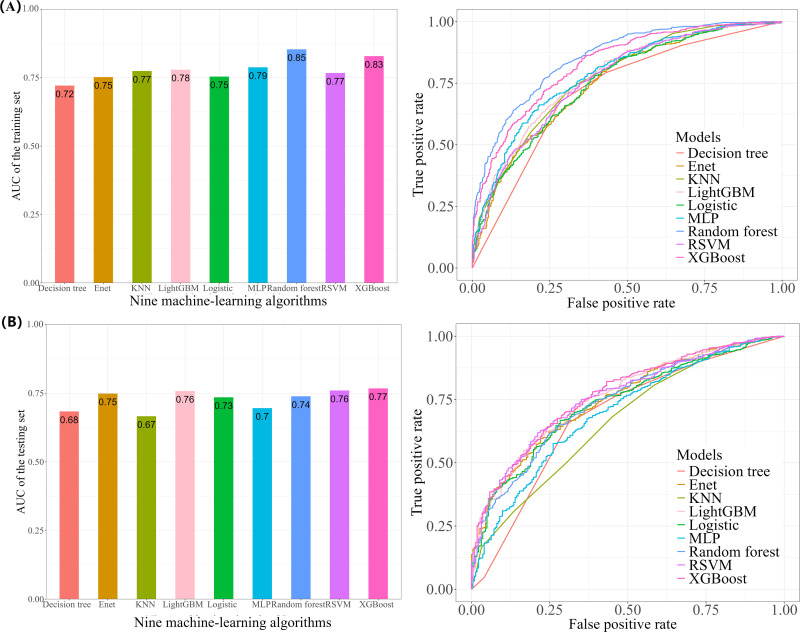
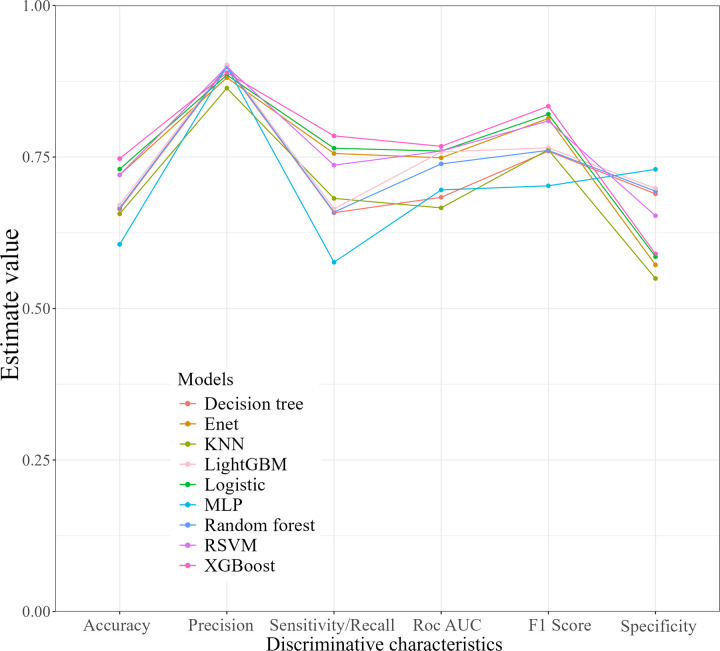
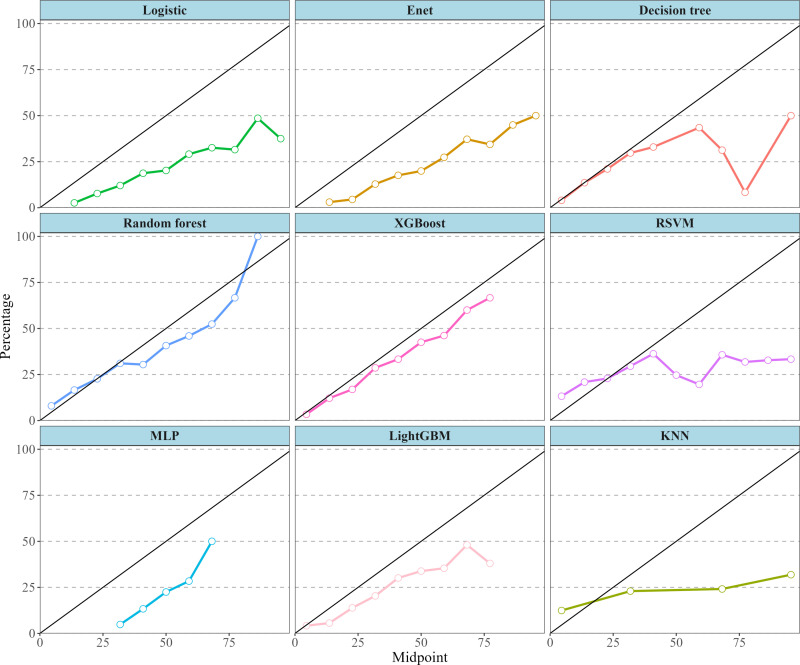
Methods: For this study, we enrolled 3,812 individuals from NHANES 2005-2016, with nine different types of BFRs serving as the exposure. We conducted advanced machine learning techniques, along with regression analysis to validate our findings from diverse perspectives. Weighted logistic regression were employed to evaluate the association of BFRs for both continuous variables after logarithmic transformation and their quartile subgroups with hyperuricemia. Restricted cubic spline (RCS) analysis was conducted to identify whether a non-linear relationship exists. Subgroup analysis enabled us to explore potential interactions of research findings across different groups. Weighted quantile sum (WQS) regression was performed to assess collective mixture sum impact, along with contributions of each component. Nine machine-learning models were developed for hyperuricemia prediction, and six discrimination characteristics were applied to select the optimal model. SHapley Additive exPlanations (SHAP) was utilized to interpret the contributions of selected variables for model decision-making capacity.
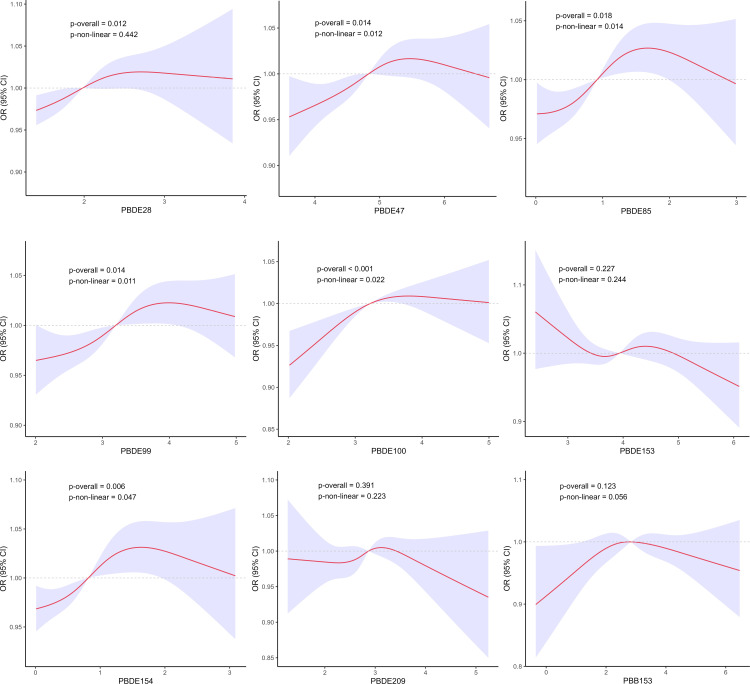
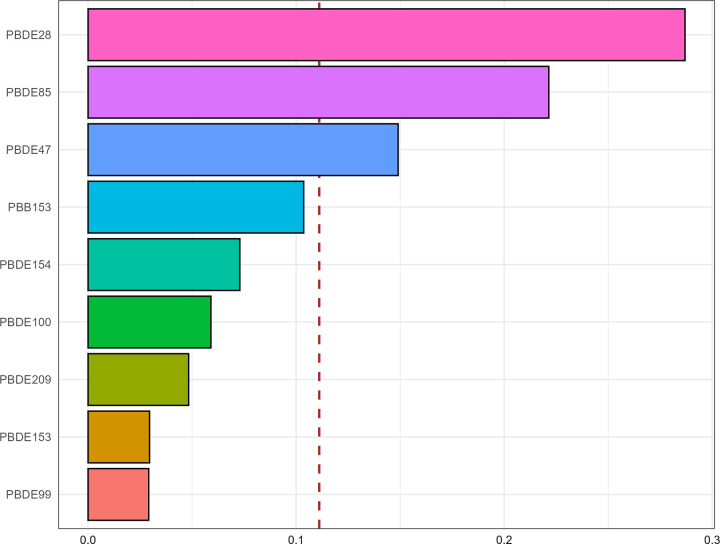
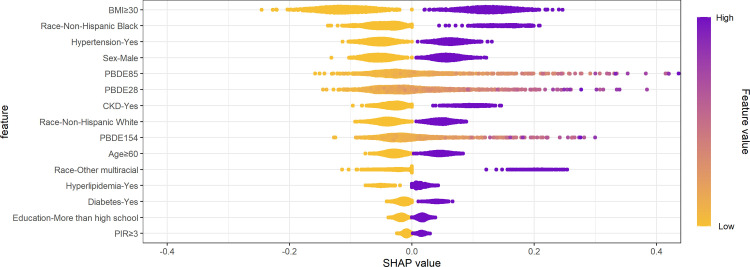
Results: Several BFRs exhibited noticeable positive correlation with the prevalence of hyperuricemia, including PBDE28 (OR: 1.27, 95% CI: 1.05-1.54, P-value = 0.014), PBDE47 (OR: 1.19, 95% CI: 1.02-1.40, P-value = 0.032), PBDE85 (OR: 1.16, 95% CI: 1.01-1.34, P-value = 0.036), PBDE99 (OR: 1.17, 95% CI: 1.02-1.34, P-value = 0.025), and PBDE154 (OR: 1.16, 95% CI: 1.00-1.34, P-value = 0.050) after fully adjustment. The WQS analysis found that the sum effect of BFRs was positively associated with hyperuricemia, of which PBDE28 (28.70%), PBDE85 (22.10%) and PBDE47 (14.90%) were the top 3 components. XGboost exhibited superior performance across several important metrics. The SHAP analysis revealed that the PBDE85, PBDE28 and PBDE154 exhibited considerable influence, ranking after "BMI≥30", "Race-Non-Hispanic Black" and "Hypertension-Yes".
Conclusions: Combining the outcomes, our study identified PBDE28 and PBDE85 as the two major significant contributors to elevated prevalence of hyperuricemia. Other components, such as PBDE154, PBDE47, PBDE99, and PBDE100, emerged as potential pollutants. These pioneering efforts highlighted the previously underrecognized impact on this environmental and public health concern.
Copyright: © 2025 Cai et al. This is an open access article distributed under the terms of the Creative Commons Attribution License, which permits unrestricted use, distribution, and reproduction in any medium, provided the original author and source are credited.
Conflict of interest statement
The authors have declared that no competing interests exist.
Figures
References
MeSH terms
Substances
LinkOut - more resources
Full Text Sources
