. 2025 Jun 26;20(6):e0326967.
doi: 10.1371/journal.pone.0326967. eCollection 2025.

Increased sensitivity of primary aniridia limbal stromal cells to travoprost, leading to elevated migration and MMP-9 protein levels, in vitro

Affiliations

Increased sensitivity of primary aniridia limbal stromal cells to travoprost, leading to elevated migration and MMP-9 protein levels, in vitro

Shuailin Li et al. PLoS One. .

Abstract

Purpose: In congenital aniridia, not only limbal epithelial cells but also limbal stromal cells may contribute to the development of aniridia associated keratopathy (AAK). Secondary glaucoma affects 50-75% of patients with congenital aniridia, and prostaglandin analogs are commonly used for conservative treatment. This study aimed to explore the effect of travoprost on corneal limbal stromal cells from healthy (LSCs) and congenital aniridia subjects (AN-LSCs), in vitro.

Materials and methods: Cells were extracted from aniridia (AN-LSCs) (n=7) and healthy donors (LSCs) (n=7). In culture, the cells were treated with travoprost at concentrations ranging from 0.039-40 μg/mL for 20 minutes. Cell viability, proliferation and migration were determined to assess the effect of travoprost on AN-LSCs and LSCs. Analysis of inflammation-, retinoic acid signaling-, and apoptosis-related genes and proteins was performed using qPCR, Western blot, and ELISA. One-way ANOVA was used to analyze cell viability and proliferation. The Mann-Whitney test was applied to compare between-group differences, while the Friedman test was used to assess within-group differences.

Results: Both in LSCs and AN-LSCs, travoprost treatment at 0.078 μg/mL and higher concentrations significantly reduced cell viability (p≤0.033; p<0.001) and proliferation decreased both in LSCs and AN-LSCs at 40 μg/mL travoprost concentration (p=0.006; p=0.002). At 6 and 12 hours, 0.313 μg/mL travoprost significantly increased the migration rate of AN-LSCs (p=0.021; p=0.021). AN-LSCs displayed lower PAX6 and JNK (MAPK8) mRNA (p<0.001) but higher MMP-3, MMP-9, ADH7, FABP5 and VEGFA mRNA levels (p≤0.037) than LSCs. PTGFR and JNK mRNA levels, MMP9 and ADH7 protein levels increased significantly in AN-LSCs after 0.313 μg/mL travoprost treatment (p≤0.039), while NF-κB and ADH7 protein levels decreased significantly in LSCs using 0.313 μg/mL travoprost (p=0.039; p<0.001).

Conclusions: Travoprost may affect viability, proliferation, and migration of both LSCs and AN-LSCs, with AN-LSCs exhibiting greater sensitivity than LSCs. Additionally, travoprost may regulate MMP-9 expression in AN-LSCs via the JNK signaling pathway. Furthermore, in AN-LSCs, travoprost treatment does not lead to a decrease in NF-κB and ADH7 protein levels.


Conflict of interest statement

The authors have declared that no competing interests exist.

Figures

Fig 1
Fig 1. Cell viability of limbal stromal cells (LSCs) and aniridia limbal stromal cells (AN-LSCs) after 20-minute treatment with travoprost at concentrations ranging from 0.039 μg/mL to 40 μg/mL (n = 7).
One-way ANOVA was performed, statistically significant p-values (p < 0.05) are indicated in the diagrams. (A) Treatment with travoprost at concentrations of 0.156 μg/mL and above led to a significant decrease in LSC viability (p ≤ 0.033). (B) Treatment with travoprost at concentrations of 0.156 μg/mL and above resulted in a significant reduction in AN-LSC viability (p < 0.001 for all).
Fig 2
Fig 2. Cell proliferation of limbal stromal cells (LSCs) and aniridia limbal stromal cells (AN-LSCs) after 20-minute treatment with travoprost at concentrations ranging from 0.039 μg/mL to 40 μg/mL, using the ELISA-BrdU (colorimetric) kit (n = 7).
One-way ANOVA was performed, statistically significant p-values (p < 0.05) are indicated in the diagrams. (A) LSC proliferation significantly decreased after treatment with 40 μg/mL travoprost (p = 0.006). (B) AN-LSC proliferation significantly decreased after treatment with 40 μg/mL travoprost (p = 0.002).
Fig 3
Fig 3. Images of the scratch assays (A, B) and migration rates (C, D, E) for limbal stromal cells (LSCs) and aniridia limbal stromal cells (AN-LSCs) at 0, 6, 12, and 24 hours following a 20-minute treatment with varying concentrations of travoprost (0.078 μg/mL, 0.156 μg/mL, and 0.313 μg/mL) (n = 5).
Scale bar: 50 μm. The Mann–Whitney test was applied to compare between-group differences (LSCs vs. AN-LSCs), while the Friedman test was used to assess within-group differences (i.e., the same cells treated with varying concentrations of travoprost). Migration rate values are presented as median with interquartile range (IQR). Significant p values (< 0.05) are highlighted at the diagrams. At, 6 and 24 hours, the migration rate in AN-LSCs was significantly higher, than in LSCs (p = 0.024; p = 0.003) (C, E). At 6 h, AN-LSCs treated with 0.313 μg/mL travoprost had a significantly higher migration rate than untreated AN-LSCs (p = 0.021) and AN-LSCs treated with 0.313 μg/mL travoprost exhibited a higher migration rate than LSCs treated with the same concentration (p = 0.032) (C). At 12 h, AN-LSCs treated with 0.313 μg/mL travoprost had a significantly higher migration rate than untreated AN-LSCs (p = 0.021) and AN-LSCs treated with 0.313 μg/mL travoprost exhibited a higher migration rate than LSCs treated with the same concentration (p = 0.016) (D).
Fig 4
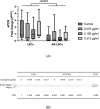
Fig 4. PAX6 mRNA levels and a representative PAX6 western blot from limbal stromal cells (LSCs) and aniridia limbal stromal cells (AN-LSCs) following a 20-minute treatment with varying concentrations of travoprost (0.078 μg/mL, 0.156 μg/mL, and 0.313 μg/mL) (n = 7).
The Mann–Whitney test was applied to compare between-group differences (LSCs vs. AN-LSCs), while the Friedman test was used to assess within-group differences (i.e., the same cells treated with varying concentrations of travoprost). mRNA values are displayed on a logarithmic scale (log₂) and presented as median with interquartile range (IQR). Significant p values (< 0.05) are highlighted at the diagrams. PAX6 mRNA levels were significantly lower in AN-LSCs than in LSCs (p < 0.001), nevertheless, a significant effect of travoprost treatment within LSC and AN-LSC groups on PAX6 mRNA expression levels could not be observed (p ≥ 0.115) (A). PAX6 protein level was too low to be detected in LSCs and AN-LSCs, while its expression could be observed in our positive controls, limbal epithelial cells (LECs) (B).
Fig 5
Fig 5. Inflammation related markers NF-κB, IL-6, IL-8, TNF-α, PTGES2, and PTGFR mRNA and NF-κB, IL-6, IL-8, and PTGES2 protein levels in limbal stromal cells (LSCs) and aniridia limbal stromal cells (AN-LSCs) following a 20-minute treatment with varying concentrations of travoprost (0.078 μg/mL, 0.156 μg/mL, and 0.313 μg/mL) (n = 7) (A-L).
NF-κB and PTGES2 protein levels have been determined using western blot, IL-6 and IL-8 protein levels using ELISA. The Mann–Whitney test was applied to compare between-group differences (LSCs vs. AN-LSCs), while the Friedman test was used to assess within-group differences (i.e., the same cells treated with varying concentrations of travoprost). mRNA values are shown on a logarithmic scale (log₂) and presented as median with interquartile range (IQR); protein values are also expressed as median with IQR. Significant p values (< 0.05) are highlighted at the diagrams. TPN LB Corr. Vol. means total lane protein local background corrected volume at the Y-axis. NF-κB, IL-6, IL-8, TNF-α, PTGES2 and PTGFR mRNA levels and IL-6 and PTGES2 protein levels did not differ significantly between LSCs and AN-LSCs groups or between any subgroups (p ≥ 0.078) (A-L). Nevertheless, NF-κB protein levels were significantly lower (p < 0.001) (B, C) in AN-LSCs, than in LSCs. Baseline NF-κB protein levels were also significantly lower (p = 0.004) (B, C) in AN-LSCs, than in LSCs. In addition, in LSCs, 0.313 μg/mL travoprost treatment significantly reduced NF-κB protein levels, compared to untreated LSCs (p = 0.039) (B, C). In AN-LSCs, 0.156 and 0.313 μg/mL travoprost treatment significantly reduced IL-8 protein levels, compared to untreated AN-LSCs (p = 0.003; p = 0.001) (G). Treatment with 0.156 and 0.313 μg/mL travoprost significantly increased PTGFR mRNA levels in LSCs (p ≤ 0.011), while treatment with 0.078, 0.156, and 0.313 μg/mL travoprost significantly elevated PTGFR mRNA levels in AN-LSCs, compared to their respective untreated controls (p ≤ 0.021) (L).
Fig 6
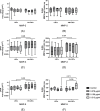
Fig 6. Mitogen-activated protein kinases (MAPKs) ERK2 (MAPK1), ERK1 (MAPK3), JNK (MAPK8), and p38 (MAPK14) mRNA levels and JNK1/2 protein levels in limbal stromal cells (LSCs) and aniridia limbal stromal cells (AN-LSCs) following a 20-minute treatment with varying concentrations of travoprost (0.078 μg/mL, 0.156 μg/mL, and 0.313 μg/mL) (n = 7) (A-F).
JNK1/2 protein level has been determined using western blot. The Mann–Whitney test was applied to compare between-group differences (LSCs vs. AN-LSCs), while the Friedman test was used to assess within-group differences (i.e., the same cells treated with varying concentrations of travoprost). mRNA values are shown on a logarithmic scale (log₂) and presented as median with interquartile range (IQR); protein values are also expressed as median with IQR. Significant p values (< 0.05) are highlighted at the diagrams. TPN LB Corr. Vol. means total lane protein local background corrected volume at the Y-axis. ERK2 (MAPK1), ERK1 (MAPK3) and p38 (MAPK14) mRNA levels and JNK1/2 protein levels did not differ significantly between LSCs and AN-LSCs (p ≥ 0.073) (A-F). Nevertheless, JNK mRNA level was significantly lower in untreated AN-LSCs, than in LSCs (p = 0.001). In addition, 0.156 and 0.313 μg/mL travoprost treatment significantly increased JNK mRNA levels in AN-LSCs, compared to untreated AN-LSCs (p = 0.021; p < 0.001) (C)‌‌.
Fig 7
Fig 7. Matrix metalloproteinases MMP-2, MMP-3, and MMP-9 mRNA and protein levels in limbal stromal cells (LSCs) and aniridia limbal stromal cells (AN-LSCs) following a 20-minute treatment with varying concentrations of travoprost (0.078 μg/mL, 0.156 μg/mL, and 0.313 μg/mL) (n = 7) (A-F).
MMP-2, MMP-3, and MMP-9 protein levels have been determined using ELISA. The Mann–Whitney test was applied to compare between-group differences (LSCs vs. AN-LSCs), while the Friedman test was used to assess within-group differences (i.e., the same cells treated with varying concentrations of travoprost). mRNA values are shown on a logarithmic scale (log₂) and presented as median with interquartile range (IQR); protein values are also expressed as median with IQR. Significant p values (< 0.05) are highlighted at the diagrams. MMP-3 and MMP-9 mRNA levels and MMP-3 protein levels were significantly higher in AN-LSCs than in LSCs groups (p ≤ 0.028) (C, D, E). In addition, MMP-9 protein level was significantly higher in 0.313 μg/mL travoprost treated AN-LSCs, than in LSCs (p = 0.011) and MMP-9 protein level was significantly higher in 0.313 μg/mL travoprost treated AN-LSCs, than in untreated AN-LSCs (p = 0.039) (F). There were no further significant differences between any other analysed groups (p ≥ 0.068).
Fig 8
Fig 8. Apoptotic markers caspase-3, Bcl-2, and Bax mRNA and caspase-3 protein levels in limbal stromal cells (LSCs) and aniridia limbal stromal cells (AN-LSCs) following a 20-minute treatment with varying concentrations of travoprost (0.078 μg/mL, 0.156 μg/mL, and 0.313 μg/mL) (n = 7) (A-E). Caspase-3 protein level has been determined using western blot. The Mann–Whitney test was applied to compare between-group differences (LSCs vs. AN-LSCs), while the Friedman test was used to assess within-group differences (i.e., the same cells treated with varying concentrations of travoprost). mRNA values are shown on a logarithmic scale (log₂) and presented as median with interquartile range (IQR); protein values are also expressed as median with IQR. Significant p values (< 0.05) are highlighted at the diagrams. TPN LB Corr. Vol. means total lane protein local background corrected volume at the Y-axis.
Fig 9
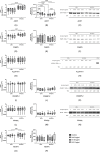
Fig 9. ADH7, FABP5, ALDH1A1, CRABP-2, PPARγ and VEGFA mRNA and ADH7, FABP5, CRABP-2, PPARγ and VEGFA protein levels in limbal stromal cells (LSCs) and aniridia limbal stromal cells (AN-LSCs) following a 20-minute treatment with varying concentrations of travoprost (0.078 μg/mL, 0.156 μg/mL, and 0.313 μg/mL) (n = 7) (A-P).
ADH7, FABP5, CRABP-2 and PPARγ protein levels have been determined using western blot and VEGFA protein levels using ELISA. The Mann–Whitney test was applied to compare between-group differences (LSCs vs. AN-LSCs), while the Friedman test was used to assess within-group differences (i.e., the same cells treated with varying concentrations of travoprost). mRNA values are shown on a logarithmic scale (log₂) and presented as median with interquartile range (IQR); protein values are also expressed as median with IQR. Significant p values (< 0.05) are highlighted at the diagrams. TPN LB Corr. Vol. means total lane protein local background corrected volume at the Y-axis. ADH7, FABP5 and VEGFA mRNA levels were significantly higher in AN-LSCs, than in LSCs (p ≤ 0.037) while ADH7 protein level was significantly lower in AN-LSCs, than in LSCs (p = 0.022) (A, B, D, O). In addition, ADH7 protein level was significantly lower in untreated AN-LSCs, than in LSCs (p = 0.007). Furthermore, 0.078 and 0.313 μg/mL travoprost treatment significantly decreased ADH7 protein levels in LSCs (p = 0.039; p < 0.001) and 0.313 μg/mL travoprost treatment significantly increased ADH7 protein levels in AN-LSCs, compared to their untreated controls (p = 0.039) (B, C). ALDH1A1 protein level was too low to be detected in LSCs and AN-LSCs, while its expression could be observed in our positive controls, corneal epithelial cells (CECs) (H). There was no further significant difference in any of the analysed mRNA and protein levels between LSCs and AN-LSCs or between any of the subgroups (p ≥ 0.065).

Similar articles

Cited by

References

    1. Landsend ECS, Lagali N, Utheim TP. Congenital aniridia - A comprehensive review of clinical features and therapeutic approaches. Surv Ophthalmol. 2021;66(6):1031–50. doi: 10.1016/j.survophthal.2021.02.011 - DOI - PubMed
    1. Hingorani M, Hanson I, van Heyningen V. Aniridia. Eur J Hum Genet. 2012;20(10):1011–7. doi: 10.1038/ejhg.2012.100 - DOI - PMC - PubMed
    1. McEntagart M, Williamson KA, Rainger JK, Wheeler A, Seawright A, De Baere E, et al. A Restricted Repertoire of De Novo Mutations in ITPR1 Cause Gillespie Syndrome with Evidence for Dominant-Negative Effect. Am J Hum Genet. 2016;98(5):981–92. doi: 10.1016/j.ajhg.2016.03.018 - DOI - PMC - PubMed
    1. Daruich A, Duncan M, Robert MP, Lagali N, Semina EV, Aberdam D, et al. Congenital aniridia beyond black eyes: From phenotype and novel genetic mechanisms to innovative therapeutic approaches. Prog Retin Eye Res. 2023;95:101133. doi: 10.1016/j.preteyeres.2022.101133 - DOI - PMC - PubMed
    1. Latta L, Figueiredo FC, Ashery-Padan R, Collinson JM, Daniels J, Ferrari S, et al. Pathophysiology of aniridia-associated keratopathy: Developmental aspects and unanswered questions. Ocul Surf. 2021;22:245–66. doi: 10.1016/j.jtos.2021.09.001 - DOI - PubMed

MeSH terms