. 2025 Jun 26;20(6):e0326872.
doi: 10.1371/journal.pone.0326872. eCollection 2025.

Comprehensive multi-omics analysis reveals the prognostic and immune regulatory characteristics of the PTPN family in osteosarcoma

Affiliations

Comprehensive multi-omics analysis reveals the prognostic and immune regulatory characteristics of the PTPN family in osteosarcoma

Changhai Long et al. PLoS One. .

Abstract

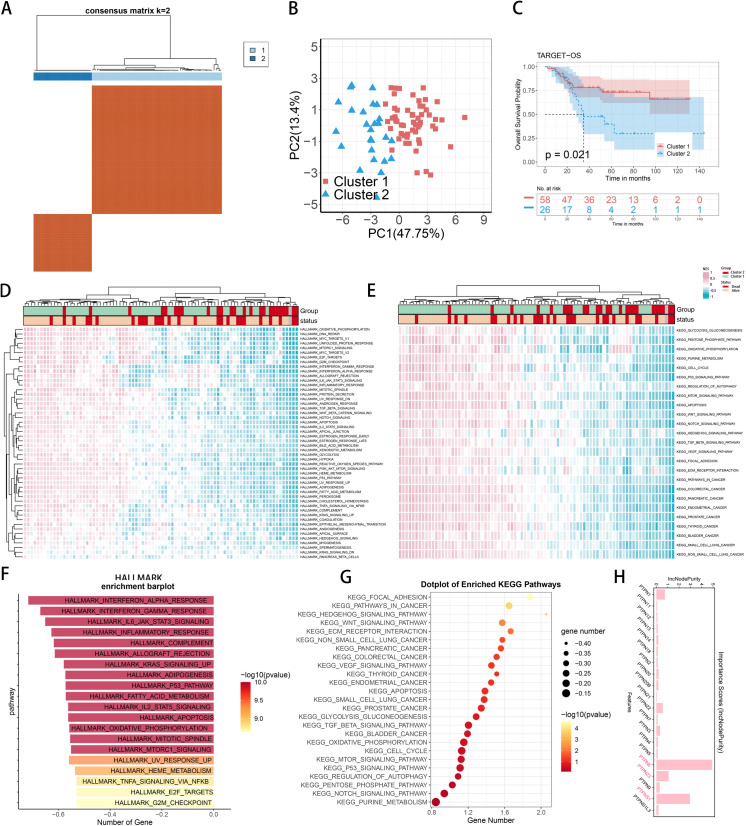
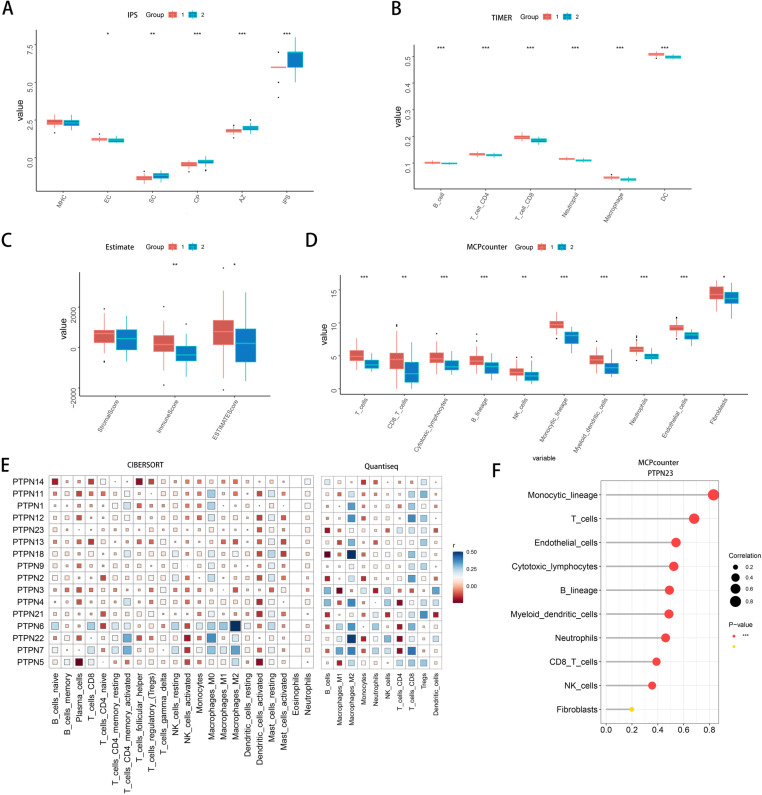
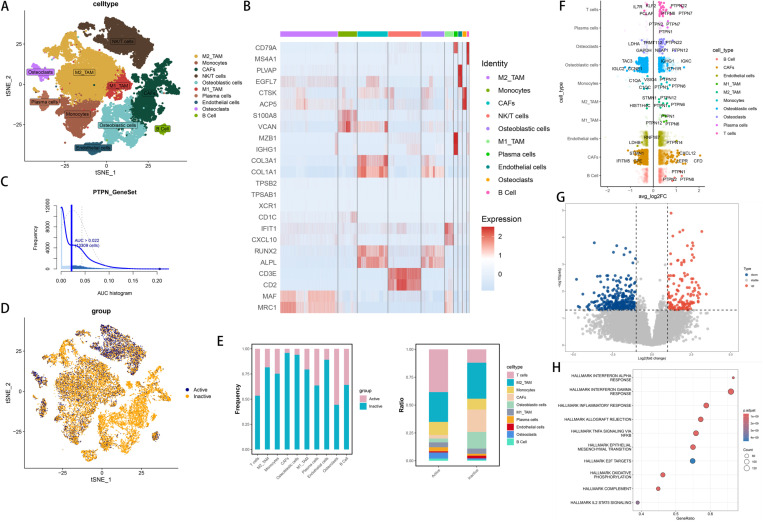
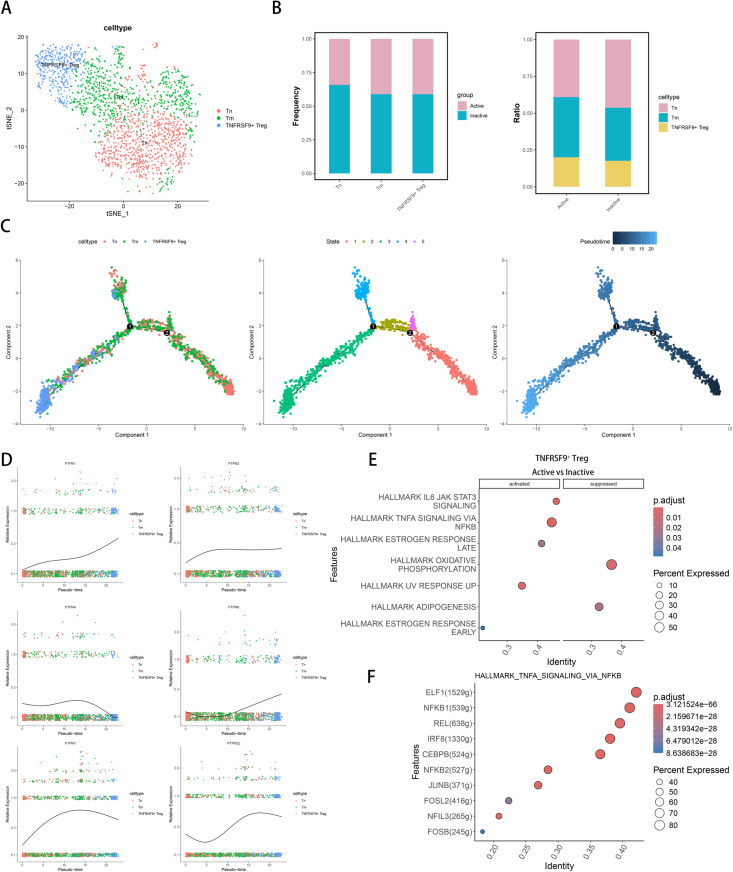
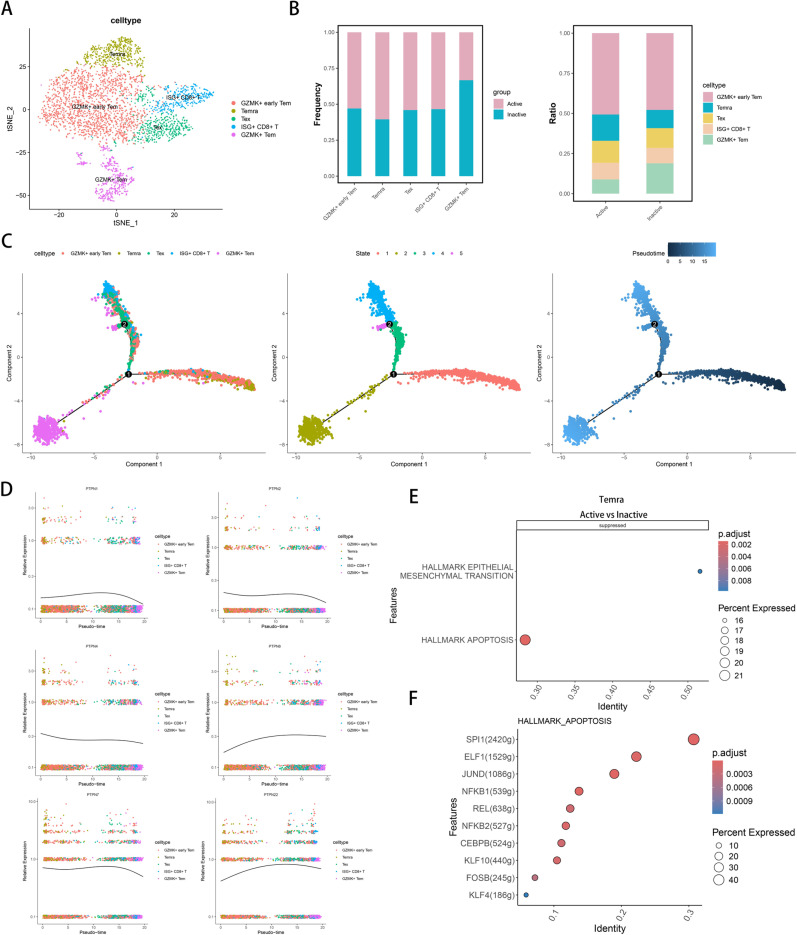
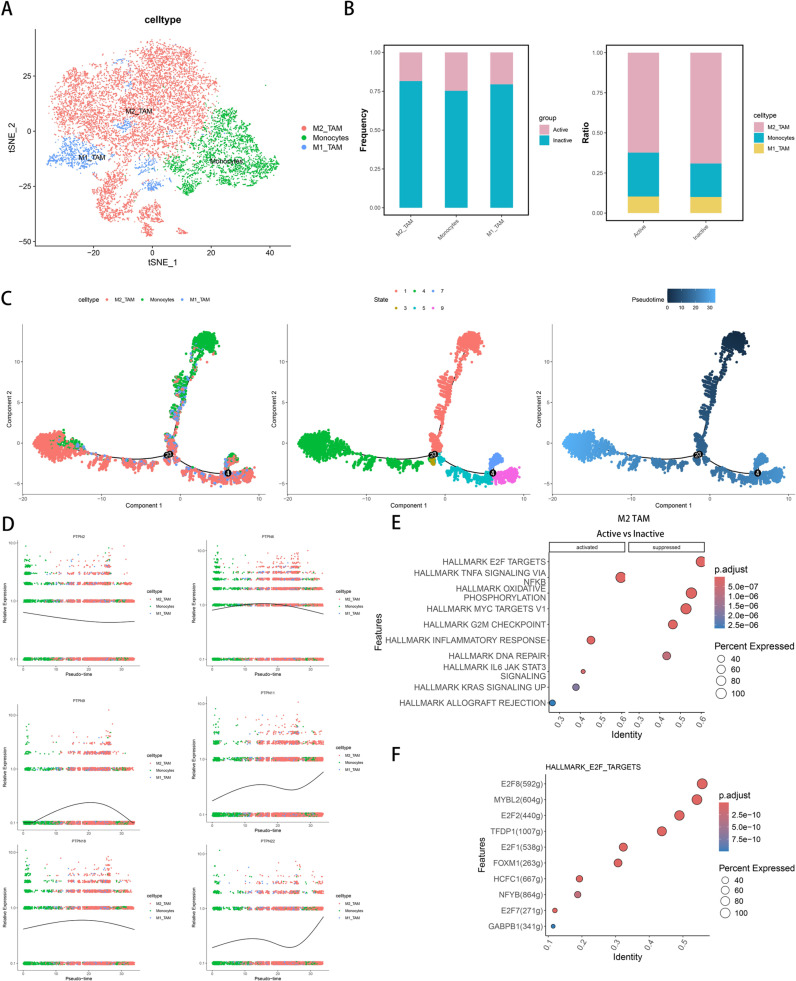
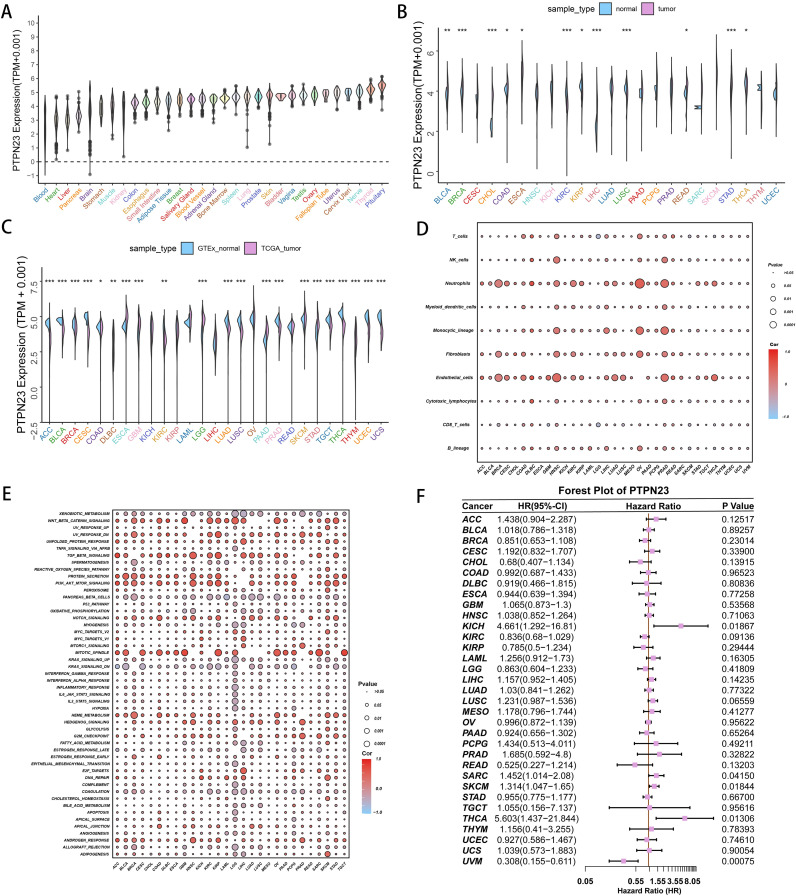
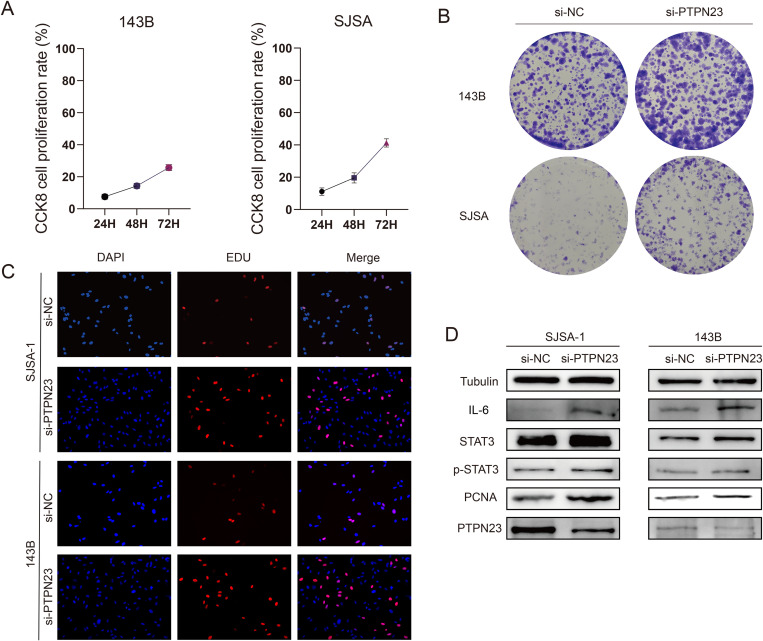
Osteosarcoma is a highly aggressive bone tumor that primarily affects adolescents and young adults, posing significant challenges in therapeutic efficacy, prognostic assessment, and treatment strategies. This study investigates the oncogenic and immune regulatory roles of the PTPN family in osteosarcoma using a comprehensive multi-omics approach. We utilized transcriptomic data, single-cell RNA sequencing (scRNA-seq), and clinical information obtained from publicly available databases. Dimensionality reduction and clustering techniques were employed to subclassify immune cells and analyze the tumor microenvironment characteristics. We identified prognostic genes associated with the PTPN family and stratified osteosarcoma cases into distinct molecular subtypes using consensus clustering. A random forest model revealed that the PTPN family has a significant impact on prognosis and modulates key oncogenic pathways. Furthermore, we analyzed the role of the PTPN family in regulating immune cells and selected PTPN23 for experimental validation. This research not only enhances prognostic assessments in osteosarcoma but also establishes a foundation for personalized therapeutic interventions.


Conflict of interest statement

The authors have declared that no competing interests exist.

Figures

Fig 1
Fig 1. Identifies two clusters with distinct survival outcomes, showing that upregulated pathways in Cluster 2 are linked to poorer prognosis.
(A) Consensus matrix (k = 2) shows two clusters. (B) Scatter plot differentiates Cluster 1 (red) and Cluster 2 (blue). (C) Kaplan-Meier curves indicate Cluster 2 has poorer prognosis (p = 0.021). (D) GSEA heatmap for Hallmark gene sets correlates Cluster 2 with worse survival. (E) GSEA heatmap for KEGG gene sets shows enriched pathways. (F) Bar chart indicates higher Hallmark pathway enrichment in Cluster 2. (G) Scatter plot highlights KEGG pathway enrichment in Cluster 2 and survival outcomes. (H) The histogram shows the impact of the PTPN family on Cluster1 and Cluster2 through random forest.
Fig 2
Fig 2. Analysis of Immune Infiltration and PTPN Gene Expression in Clusters 1 and 2.
(A-D) Boxplots show differential expression of immune markers and enrichment scores between Cluster 1 (red) and Cluster 2 (blue). Significance: *p < 0.05, **p < 0.01, ***p < 0.001. (E) Correlation heatmap of immune infiltration types (CIBERSORT and Quantiseq) vs. PTPN family genes. (F) Enrichment scatter plot of immune cell types vs. enrichment levels.
Fig 3
Fig 3. Analysis of Cellular Heterogeneity and Differential Gene Expression in Active and Inactive Groups.
(A) tSNE plot show 10 cellular clusters by cell type. (B) Heatmap of marker gene expression across clusters. (C) The bar chart illustrates that at an AUC threshold of 0.022, 13,402 cells were identified as Active using AUCell. (D) tSNE plot differentiating Active (blue) and Inactive (yellow) groups. (E) Stacked bar chart of cellular subset proportions in Active and Inactive groups. (F) The volcano plots of different cell types illustrate the differentially expressed genes (DEGs) between the Active and Inactive groups. (G) Volcano plots of differentially expressed genes (DEGs) between Active and Inactive groups were generated based on pseudobulks. (H) Dot plots of Hallmark gene set enrichment analysis.
Fig 4
Fig 4. Analysis of CD4+ T Cell Subpopulations and Functional States in Active and Inactive Groups.
(A) tSNE plot of CD4+ T cell subsets: Tn, Tm, and Treg.(B) Stacked bar charts showing CD4+ T cell subset proportions between Active and Inactive groups. (C) Scatter plot of CD4+ T cell trajectories from Monocle2 by subtype and pseudotime. (D) Scatter plot of PTPN gene expression across CD4+ T cell subsets along pseudotime. (E) Enrichment scatter plot of pathway changes in TNFRSF9+ Treg cells between groups. (F) Enrichment scatter plot of transcriptional regulators in the TNFA_signaling_via_NFkB pathway for Treg cells.
Fig 5
Fig 5. Characterization and Functional Analysis of CD8 + T Cell Subsets in Active and Inactive Groups.
(A) tSNE plot of CD8+ T cell subsets.(B) Stacked bar charts of CD8+ T cell subset proportions between Active and Inactive groups. (C) Scatter plot of CD8+ T cell pseudotime trajectory from Monocle2. (D) Scatter plot of PTPN gene expression dynamics across CD8+ T cells along pseudotime. (E) Enrichment scatter plot of pathway changes in Temra cells. (F) Enrichment scatter plot of transcriptional regulators in the Apoptosis pathway for Temra cells.
Fig 6
Fig 6. Heterogeneity and Functional Trajectory of Mononuclear Phagocytes in Active and Inactive Groups.
(A) tSNE plot of mononuclear plagocyte subsets: monocytes,M1_TAM, and M2_TAM. (B) Stacked bar charts showing proportional changes of mononuclear phagocyte subsets between Active and Inactive groups. (C) Scatter plot of pseudotemporal trajectories of mononuclear phagocyte subsets from Monocle2. (D) Scatter plot of PTPN gene expression dynamics across mononuclear phagocyte subsets along the pseudotemporal trajectory. (E) Enrichment scatter plot of pathway changes in M2_TAM between Active and Inactive groups. (F) Enrichment scatter plot of transcriptional regulators in the E2F pathway for M2_TAM.
Fig 7
Fig 7. Pan-Cancer Analysis of PTPN23 Expression and Its Associations with Clinical Outcomes and Immune Infiltration.
(A) PTPN23 mRNA expression across cancer types in TCGA. (B) PTPN23 expression comparison between normal and tumor samples in TCGA. (C) PTPN23 expression in normal (GTEx) vs. tumor (TCGA) samples. (D) Correlation of PTPN23 expression with immune cell infiltration across cancers. (E) Correlation of PTPN23 expression with Hallmark gene sets and immune pathways. (F) Forest plot of PTPN23 prognostic significance across different cancers. *p < 0.05, **p < 0.01, ***p < 0.001, ****p < 0.0001.
Fig 8
Fig 8. Regulation of osteosarcoma cell proliferation by PTPN23.
(A) Absorbance at 450 nm after CCK8 treatment in PTPN23 groups; higher absorbance indicates more cell proliferation. (B) Plate cloning results for SRSF7 treatment groups. (C) Hoechst & EDU staining showing proliferative activity in PTPN23 groups was captured under a 20x (200μm) magnification. (D) Protein expression levels of PTPN23, PCNA, IL-6, STAT3, and p-STAT3 in SJSA-1 and 143B cells from knockdown and control groups. The raw data of the protein bands are stored in S8 Raw images.

Similar articles

References

    1. Beird HC, Bielack SS, Flanagan AM, Gill J, Heymann D, Janeway KA, et al. Osteosarcoma. Nat Rev Dis Primers. 2022;8(1):77. doi: 10.1038/s41572-022-00409-y - DOI - PubMed
    1. Mirabello L, Troisi RJ, Savage SA. Osteosarcoma incidence and survival rates from 1973 to 2004: data from the Surveillance, Epidemiology, and End Results Program. Cancer. 2009;115(7):1531–43. doi: 10.1002/cncr.24121 - DOI - PMC - PubMed
    1. Taran SJ, Taran R, Malipatil NB. Pediatric Osteosarcoma: An Updated Review. Indian J Med Paediatr Oncol. 2017;38(1):33–43. doi: 10.4103/0971-5851.203513 - DOI - PMC - PubMed
    1. Gonzalez AL, Cates JMM. Osteosarcoma: Differential Diagnostic Considerations. Surg Pathol Clin. 2012;5(1):117–46. doi: 10.1016/j.path.2011.07.011 - DOI - PubMed
    1. Cole S, Gianferante DM, Zhu B, Mirabello L. Osteosarcoma: A Surveillance, Epidemiology, and End Results program-based analysis from 1975 to 2017. Cancer. 2022;128(11):2107–18. doi: 10.1002/cncr.34163 - DOI - PMC - PubMed

MeSH terms

Substances