. 2025 Jun 26:eadv2367.
doi: 10.1126/science.adv2367. Online ahead of print.

Divergent FOXA1 mutations drive prostate tumorigenesis and therapy-resistant cellular plasticity

Affiliations

Divergent FOXA1 mutations drive prostate tumorigenesis and therapy-resistant cellular plasticity

Sanjana Eyunni et al. Science. .

Abstract

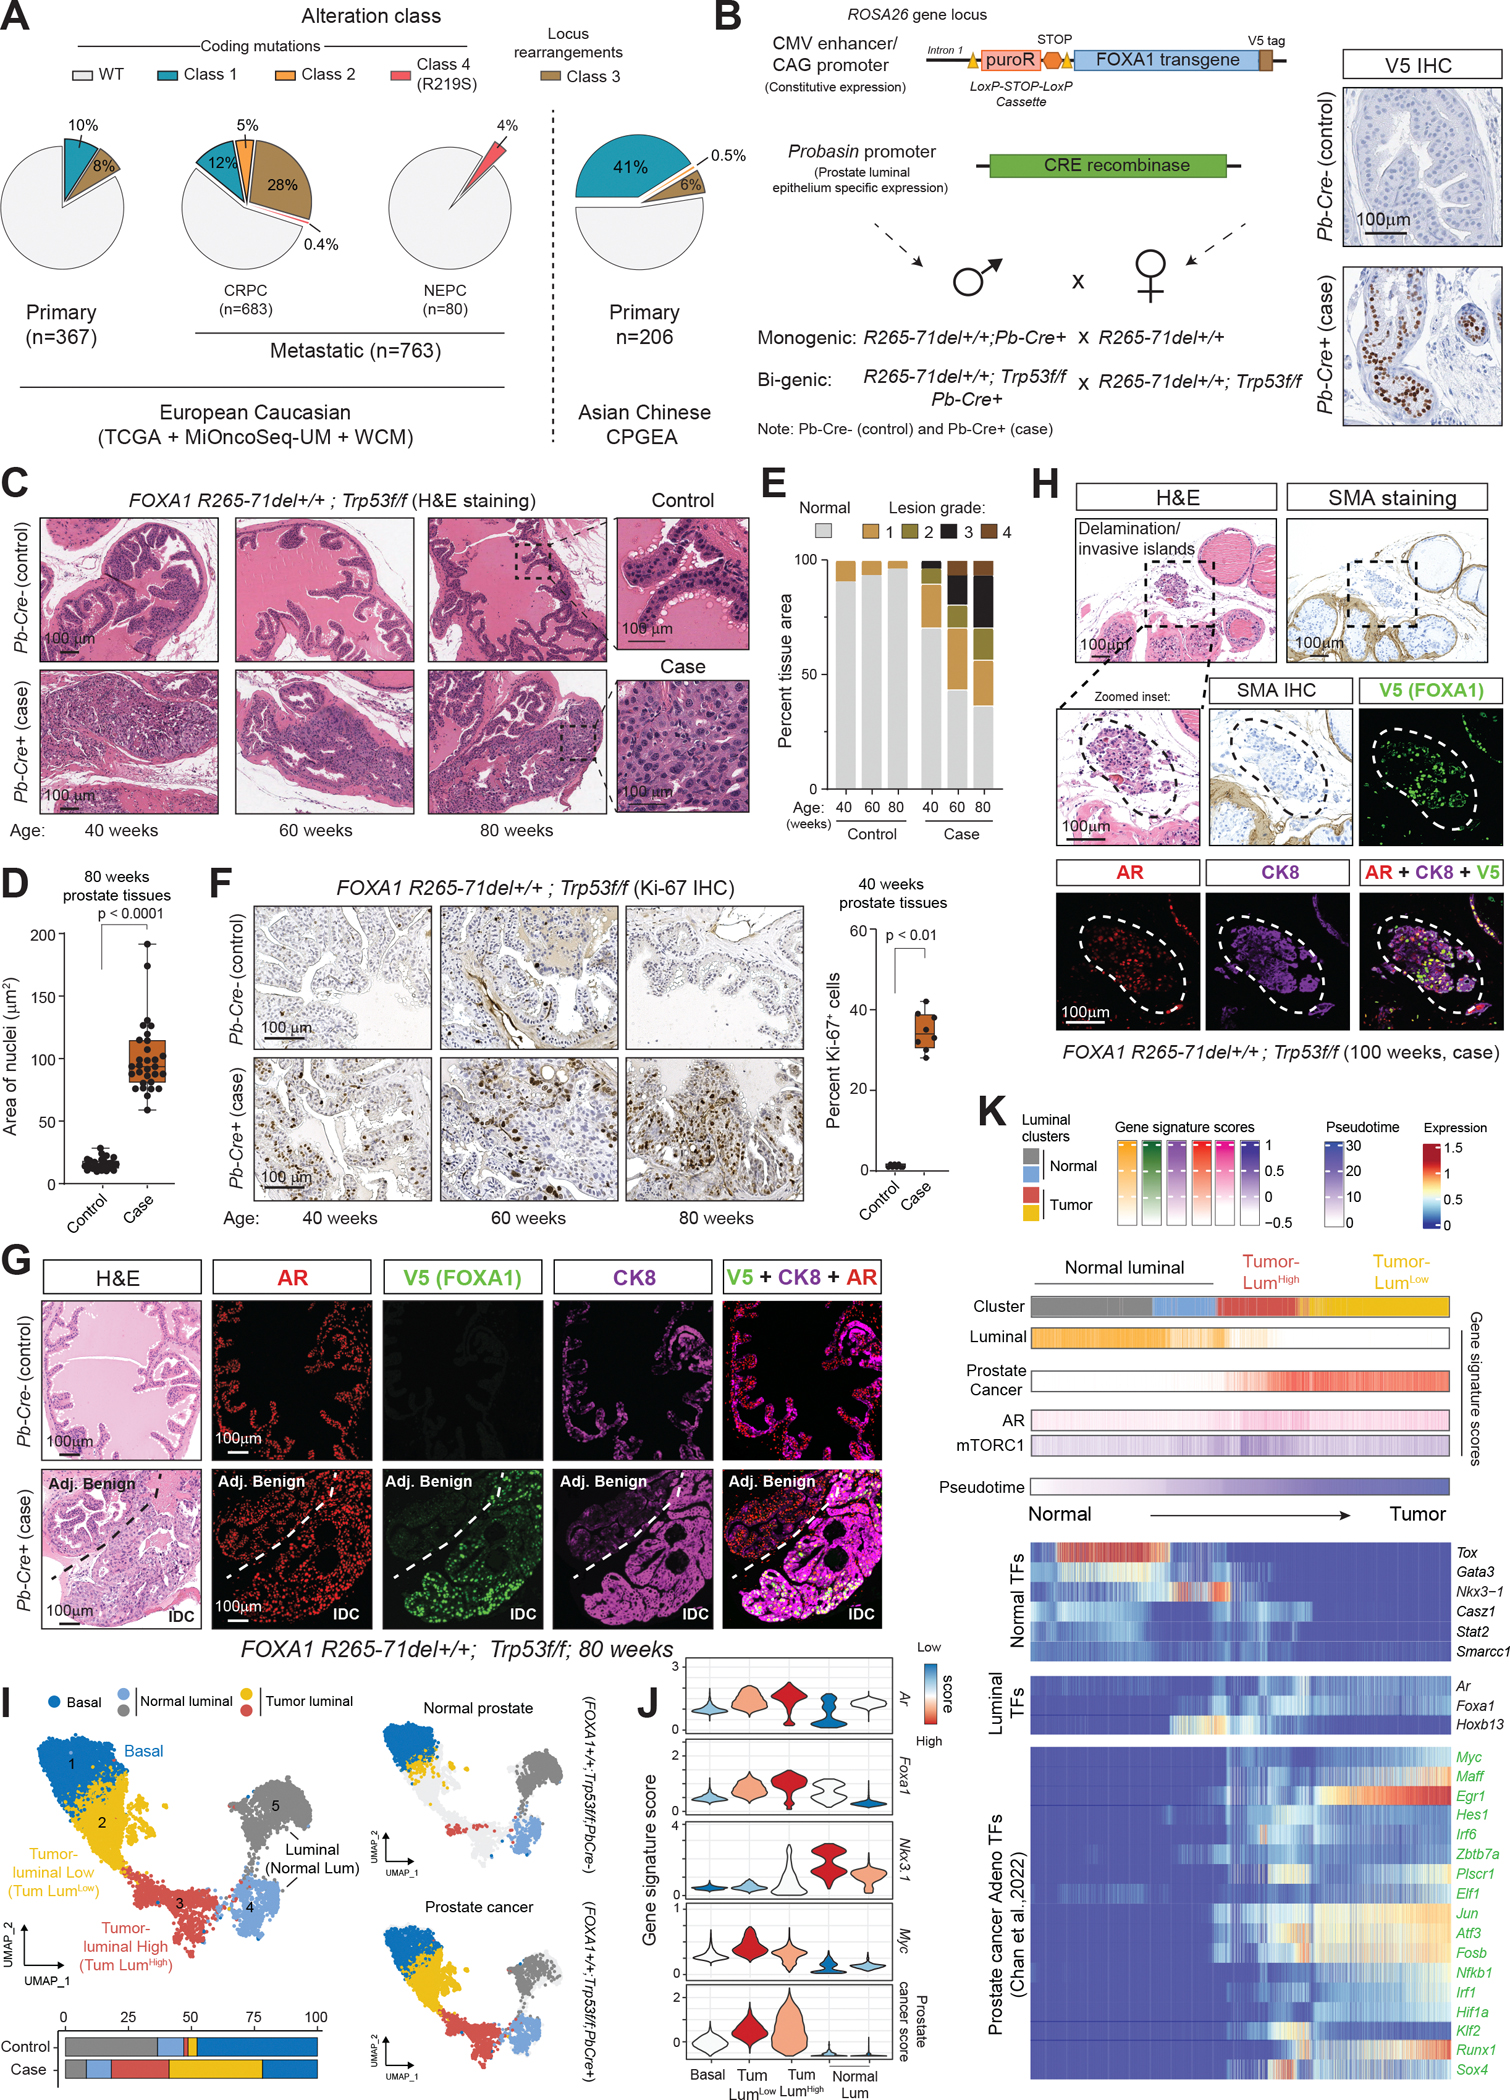
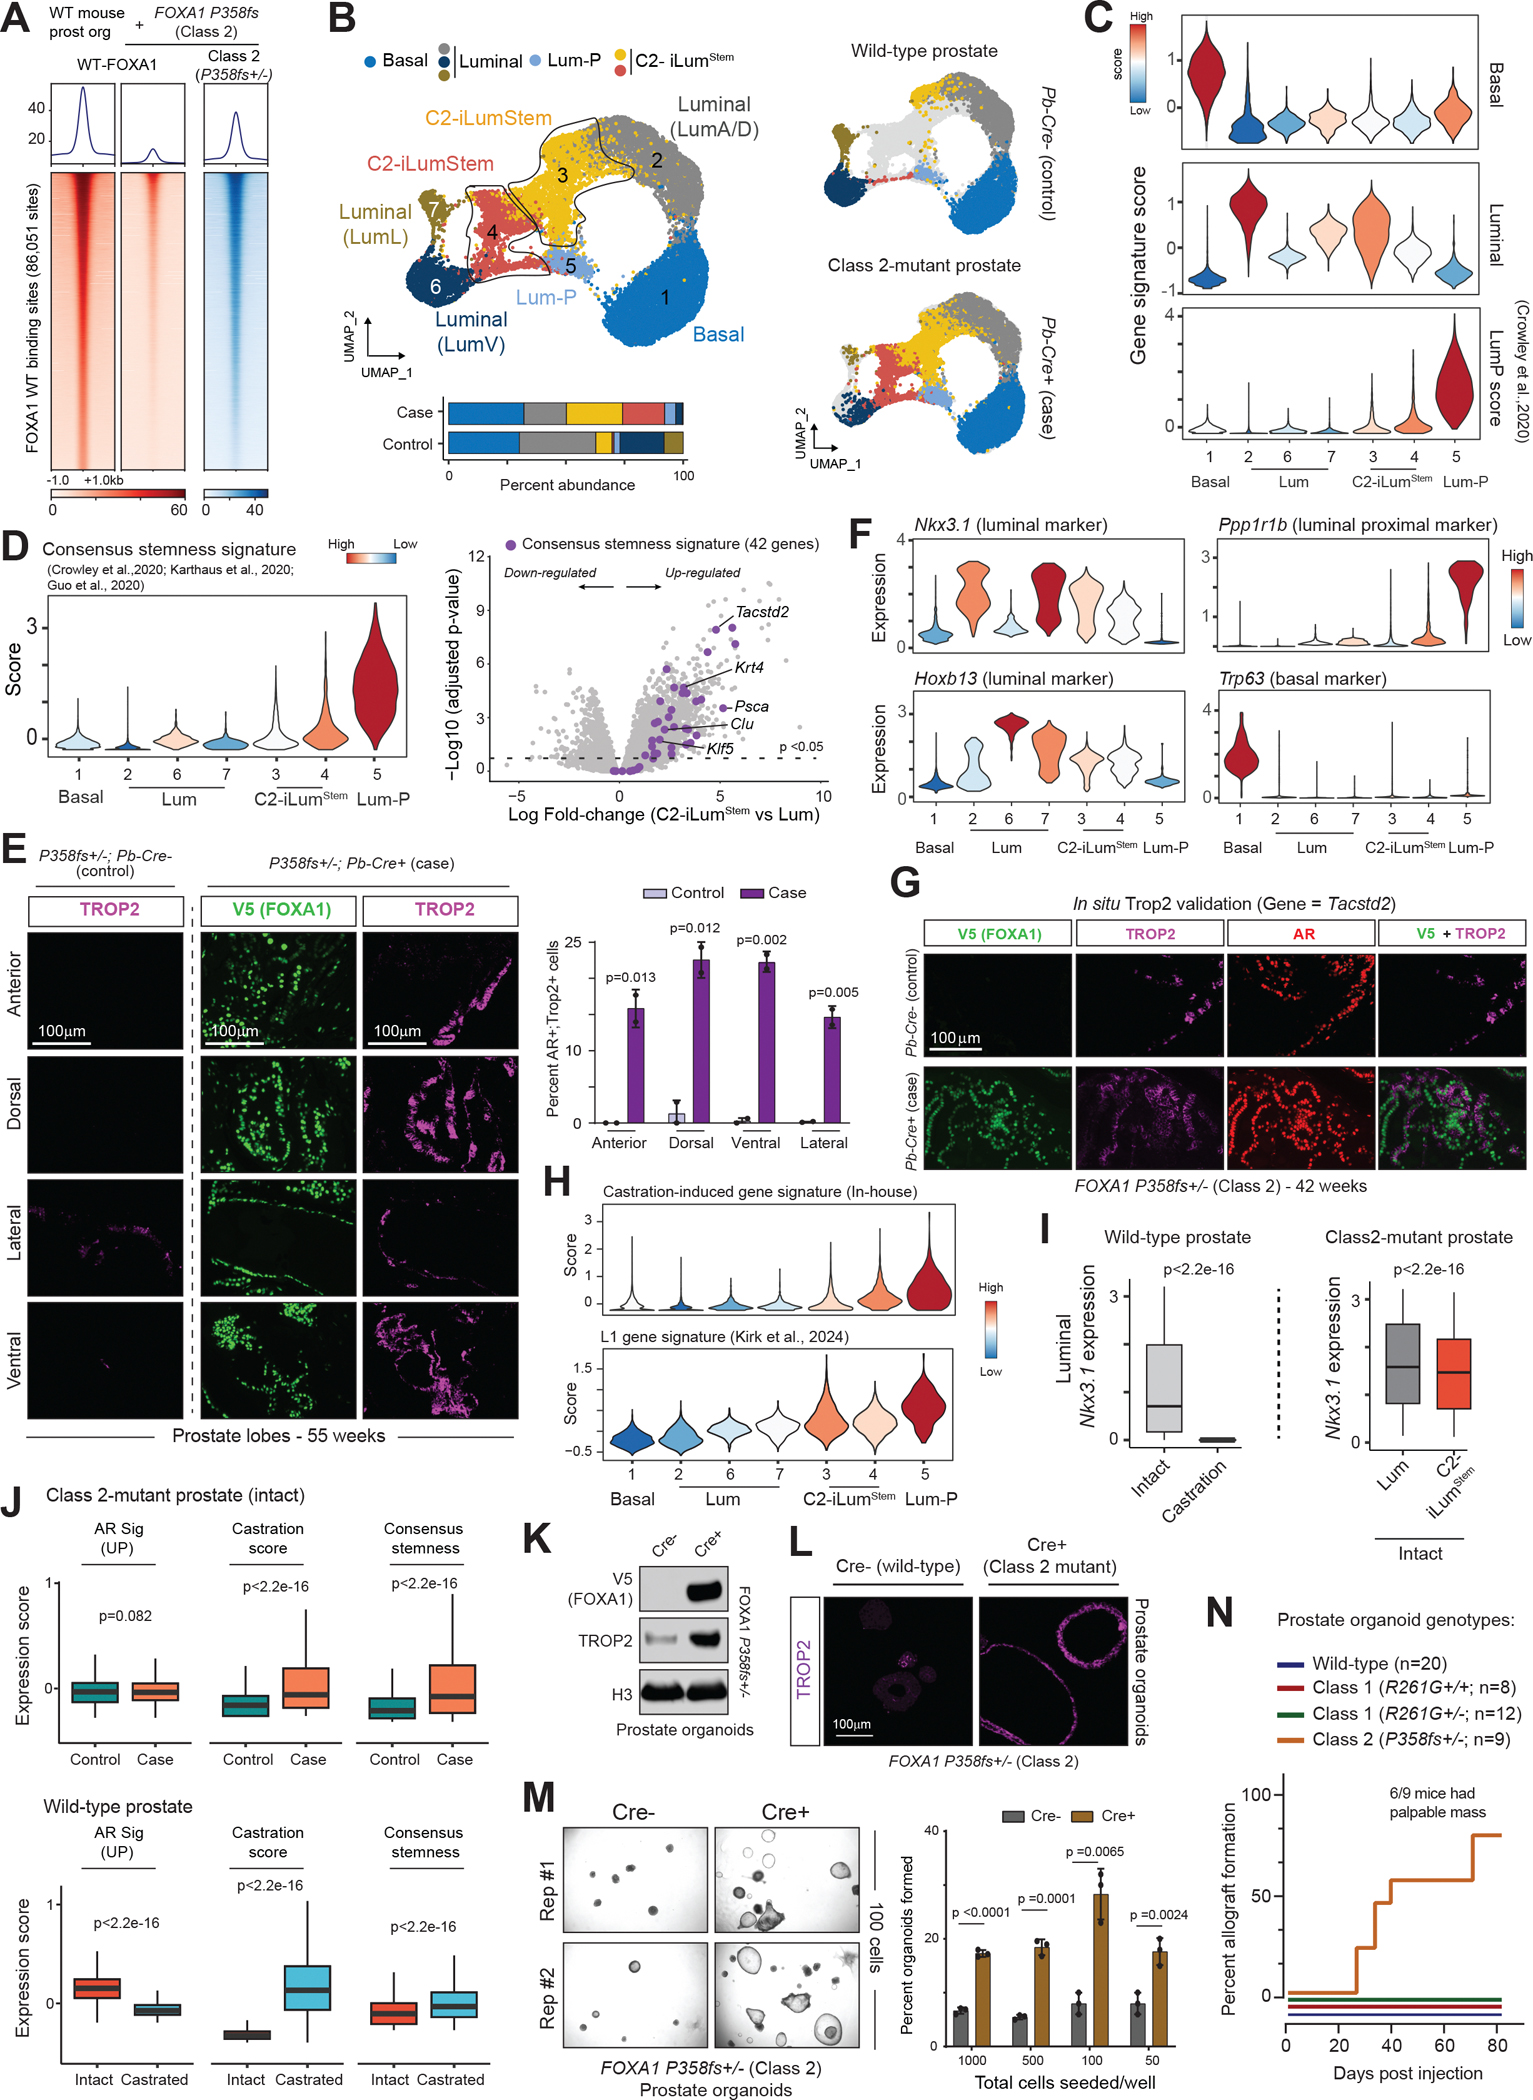
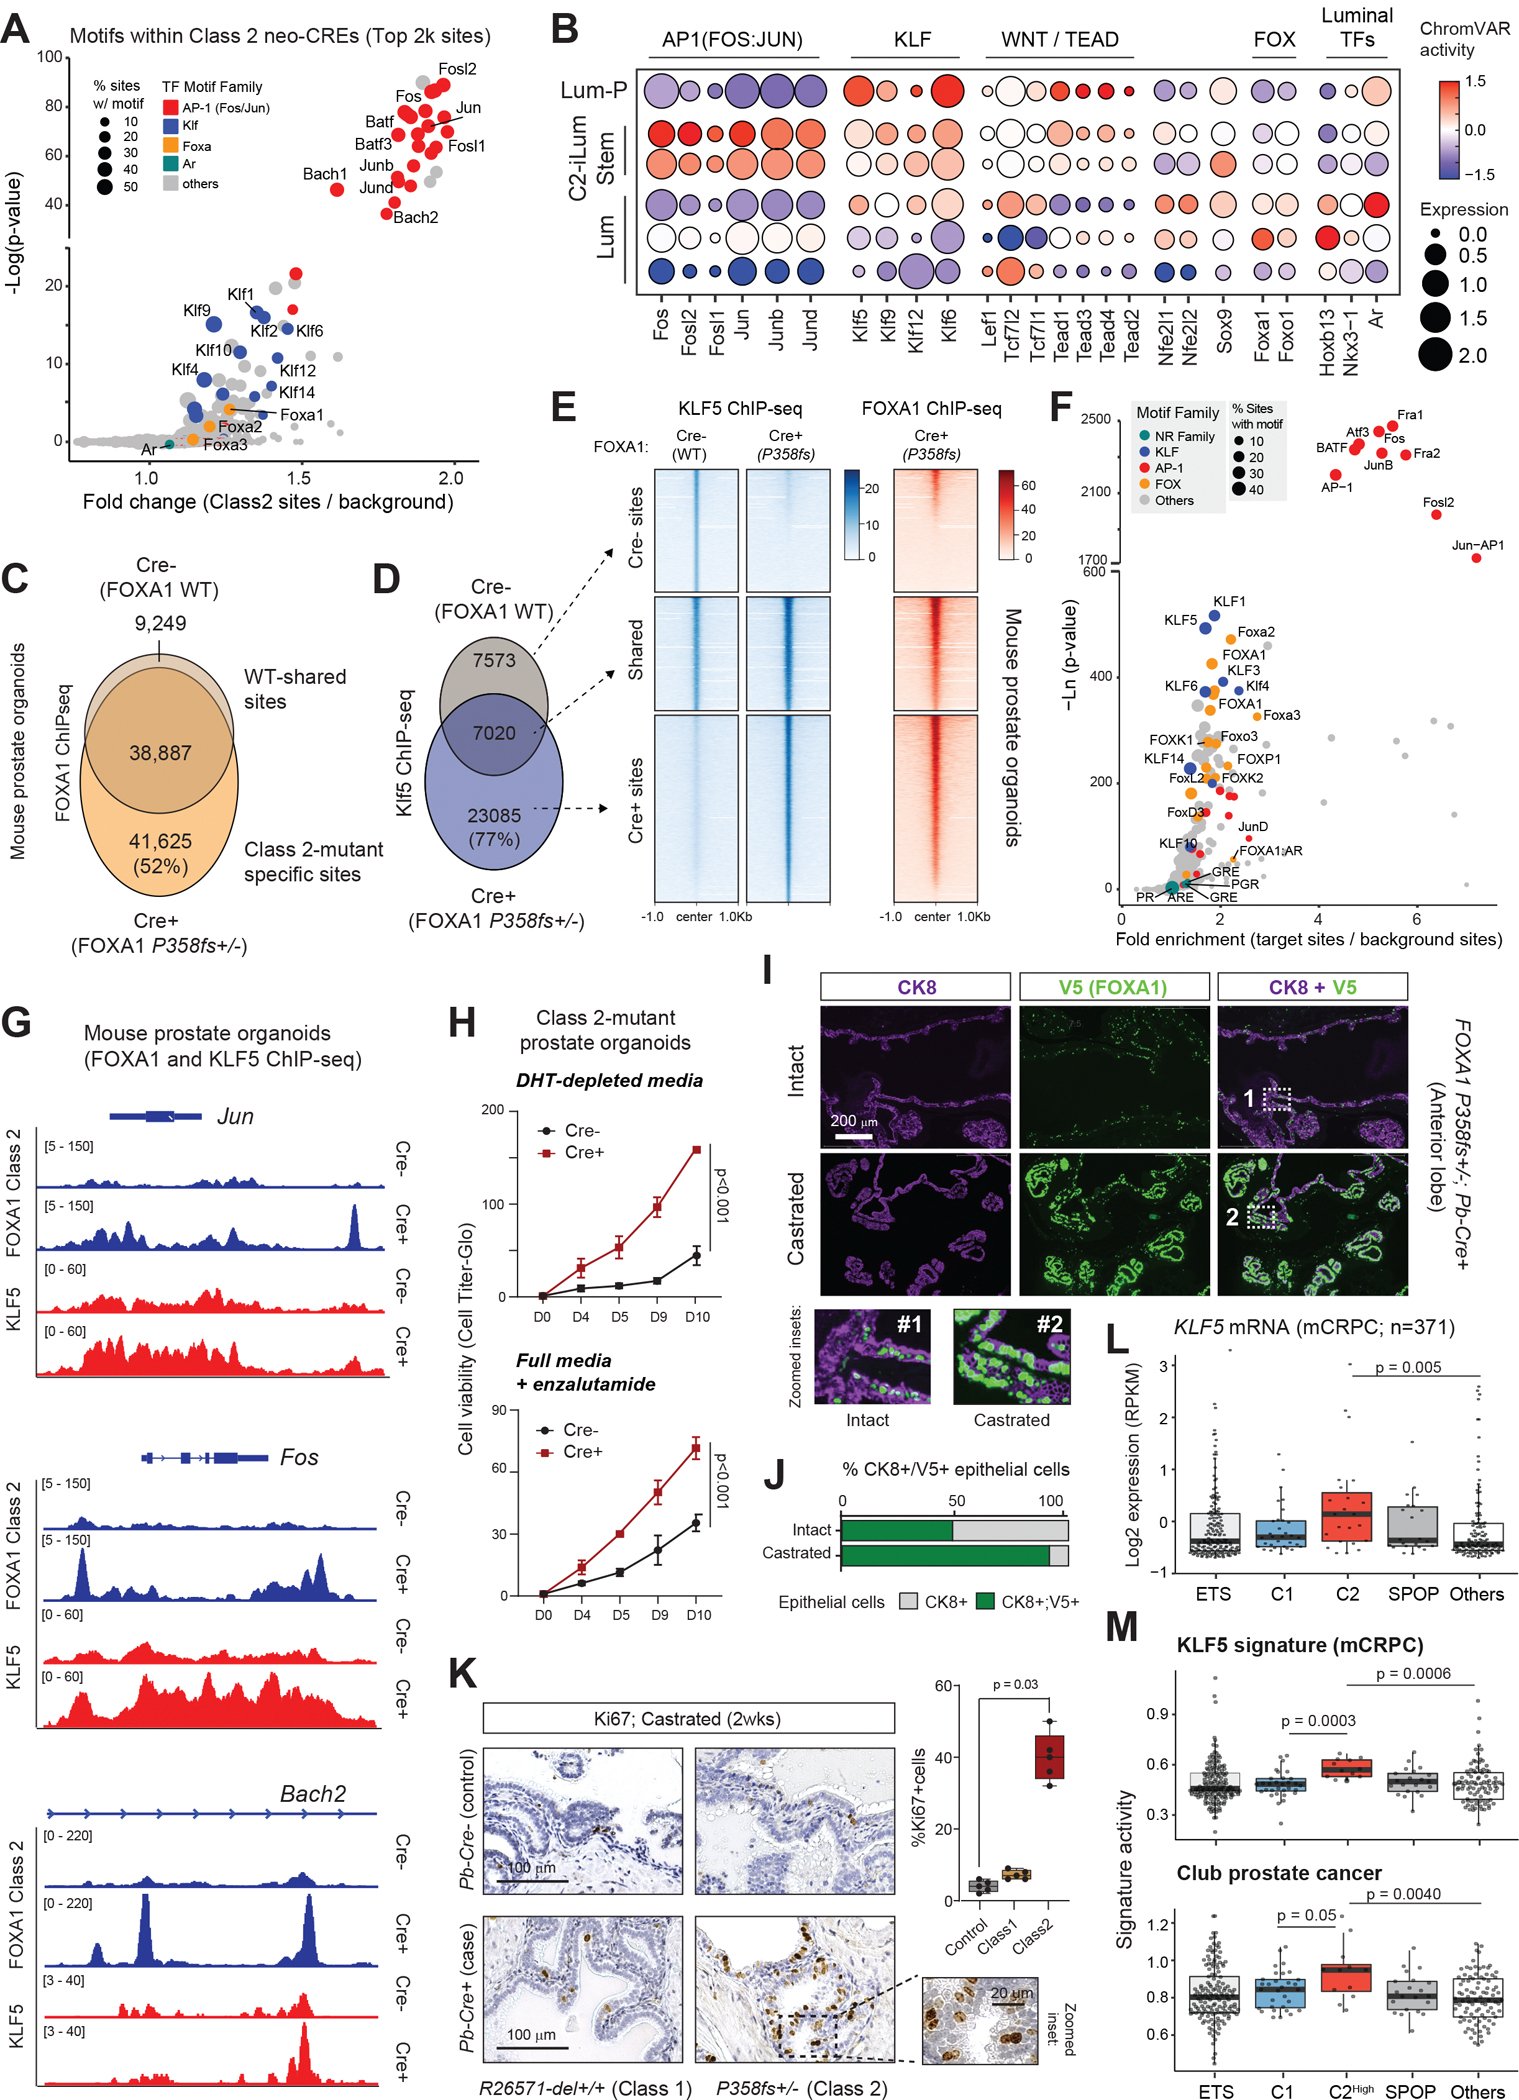
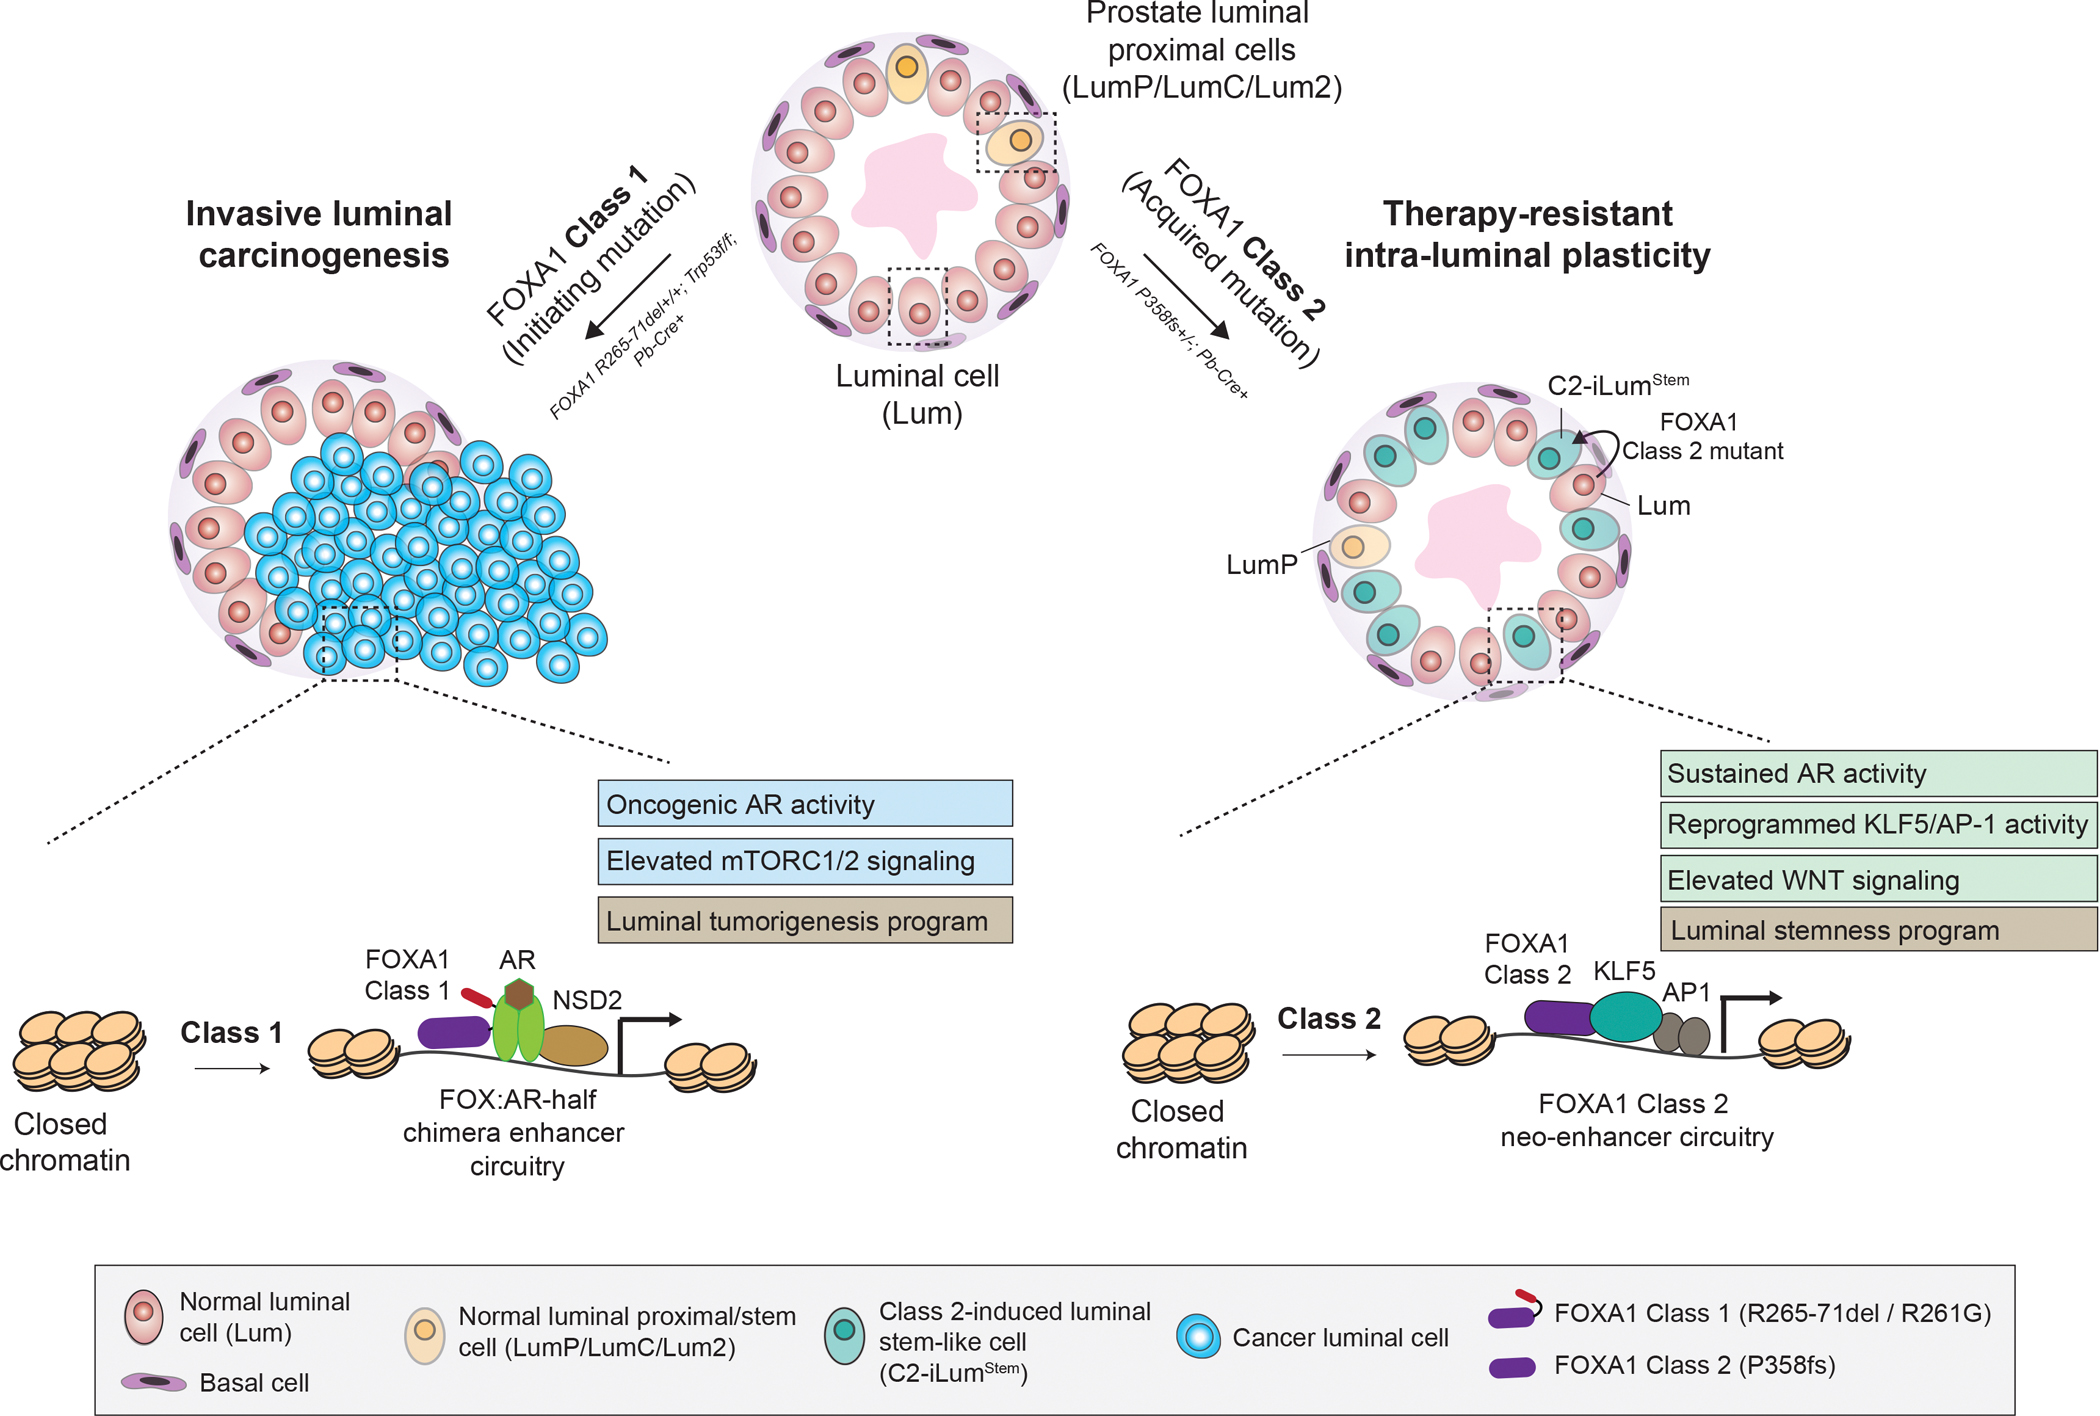
FOXA1 is altered in 10 to 40% of prostate cancers, yet its oncogenic mechanisms remain uncharacterized in vivo. We developed knock-in mouse models representing distinct classes of FOXA1 mutations. Histopathological and multi-omic analyses of prostate tissues and organoids revealed that Class 1 mutations, in conjunction with p53 inactivation, drive androgen-dependent adenocarcinomas through co-activation of mTORC1/2 and oncogenic AR signaling stemming from chimeric AR-half enhancers. In contrast, Class 2 mutations induce intra-luminal plasticity by reprogramming differentiated luminal cells into a progenitor-like state through activation of KLF5 and AP-1 neo-enhancer circuitries, which enables enhanced survival and proliferation even under castrate androgen levels. Our findings establish FOXA1 as a multifaceted oncogene, with distinct mutational classes divergently evolving to drive prostate tumorigenesis or therapy-resistant progression.


Conflict of interest statement

Competing interests: A.M.C. is a co-founder and serves on the scientific advisory board of Lynx Dx, Flamingo Therapeutics, NuLynx Therapeutics, Medsyn Pharma, and Esanik Therapeutics. A.M.C. serves as an advisor to Tempus, Aurigene Oncology, and Ascentage. The remaining authors declare no conflicts of interests.

Figures

Fig. 1.
Fig. 1.. FOXA1 Class 1 mutants drive high-grade invasive adenocarcinoma in the background of p53 loss.
A) Frequency of FOXA1 alterations in the European (primary and metastatic) and Asian (primary) prostate cancer patient cohorts. FOXA1 Class 1 mutations are truncal alterations seen in the primary and metastatic disease (10–12%) and comprise in-frame indels and missense mutations in the wing2 region of the protein. Class 2 mutations are acquired in the metastatic disease and comprise truncating frameshift alterations in the C-terminal region of the protein. Class 3 mutations are structural alterations (duplications and translocations) within the FOXA1 syntenic loci found in the primary and metastatic disease (8–28%). FOXA1 Class 4 mutations comprise the missense R219S alteration that is primary enriched in NEPC tumors (4%). Indel, insertion, and deletion; CRPC, castration-resistant prostate cancer; NEPC, neuroendocrine prostate cancer; U-M, University of Michigan; WCM, Weill Cornell Medicine; CPGEA: Chinese Prostate Cancer Genome and Epigenome Atlas. B) Left: Schematic of FOXA1 Class 1 (R265–71del) knock-in transgenic mouse models and mating strategies for monogenic (R265–71del+/+) and bigenic (R265–71del+/+; Trp53f/f) mouse lines. Probasin-Cre (Pb-Cre) ensures prostate-specific expression of FOXA1. Control and case animals are denoted as Pb-Cre− and Pb-Cre+, respectively. Right: V5-epitope tag immunohistochemistry (IHC) in control (Pb-Cre−) and case (Pb-Cre+) R265–71del+/+ animals. Scale=100μm. C) Representative Hematoxylin and Eosin (H&E) stained cross-sections of FOXA1 R265–71del+/+;Trp53f/f control and case prostate tissues (anterior lobe) from 40 to 80 week-old mice. Black-dotted boxes denote zoomed insets. Scale=100μm. D) Area of nuclei in 80-week-old control and case FOXA1 R265–71del+/+;Trp53f/f prostate tissues (two-tailed t-test). E) Histopathological grading of tissues from panel c. Grade 1: Hyperplasia, Grade 2: Low/high-grade prostate intraepithelial neoplasia (PINs), Grade 3: Florid high-grade PINs and/or Atypical Intraductal Proliferation (AIP) and/or Intraductal carcinoma (IDC), Grade 4: Invasive adenocarcinoma. F) Left: Ki67 IHC in control and case FOXA1 R265–71del+/+;Trp53f/f prostate tissues at 40, 60, and 80 weeks. (Scale=100μm). Right: Statistical representation of quantification (percentage of KI67-positive cells) from 40-week-old tissues from the left panel (two-tailed t-test). Box plot: center line, median; box, interquartile range (Q1–Q3); whiskers, minimum to maximum values; all individual data points shown. G) Representative H&E and multiplex immunofluorescence of V5, AR, and CK8 in FOXA1 R265–71del+/+;Trp53f/f 80-week-old prostate tissues. Adjacent benign and intraductal carcinoma (IDC) tumor regions are marked. Scale=100μm. H) Representative H&E, alpha-smooth muscle actin (SMA) IHC and multiplex immunofluorescence of noted proteins in FOXA1 R265–71del+/+;Trp53f/f 100-week-old tissues. Invasive islands denoting breach of basement membrane (lack of SMA) are highlighted in a black, dotted box. Scale=100μm. I) Left: Uniform Manifold Approximation and Projection (UMAP) plots from single-cell RNA-seq data of FOXA1 R265–71del+/+;Trp53f/f 100-week-old anterior and dorsal prostate lobes. Tumor cell clusters are highlighted in yellow and red. Right: Split UMAP plots with only case or control tissue-derived cells colored across clusters. J) Violin plots showing expression of Ar, Foxa1, Nkx3.1, Myc and a prostate cancer score (defined in this paper; see Methods) in distinct cell populations described in panel I. K) Heatmap of select transcription factor (TF) gene expression along the pseudotime (Slingshot, see Methods) from normal luminal cells to tumor cells derived from FOXA1 R265–71del+/+;Trp53f/f control and case prostate tissues. The top heatmaps show aggregate z-scores of luminal, AR, mTORC1, and prostate cancer signature genes.
Fig. 2.
Fig. 2.. FOXA1 Class 1 mutants co-activate AR and mTORC1 oncogenic signaling.
A) Left: UMAP plots from single-cell RNA-seq data of R265–71del+/+;Trp53f/f tissues showing the meta-score of AR and mTORC1 gene signatures. Right: Violin plots of AR and mTORC1 gene signature scores in the tumor and normal clusters. B) Gene set enrichment analysis (GSEA) plots for PI3K and FOXA1 Class 1 activated genes from FOXA1 Class 1 or PI3K mutant patient tumor tissues. DEGS, differentially expressed genes (GSEA enrichment test). C) Representative H&E and Ki67 IHC in Class 1 R265–71del+/+;Trp53f/f isogenic organoids. Cre− organoids are wild-type/normal organoids, while Cre+ organoids are tumor organoids. Scale=100μm. D) Immunoblot of labeled proteins in the Cre− and Cre+ tumor organoids. Total H3 is used as a loading control. E) GSEA plots of AR and mTORC1 up-regulated genes using the fold change from FOXA1 R265–71del+/+;Trp53f/f Cre+ vs Cre− tumor organoids. DEGS, differentially expressed genes. (n=2 biological replicates, GSEA enrichment test). F) Immunoblot of labeled proteins in R265–71del+/+ Cre− and Cre+ organoids treated with MK2206 (AKT inhibitor), rapamycin (mTORC1 inhibitor), torin (mTORC1/2 inhibitor), or ARD61 (AR degrader) for 24 hours. G) Growth curves (cell titer glow) of Class 1 single gene (R261G+/−) and two-gene (R265–71del+/+; Trp53f/f) Cre− and Cre+ organoid lines grown in full media or media lacking DHT and EGF (n=4 biological replicates, two-sided t-test, mean with SD is shown). H) Representative images of Class 1 (R261G+/+) Cre− and Cre+ organoids grown in complete media or media depleted of EGF and DHT. I) Venn diagram showing overlaps of AR ChIP-seq in Cre− and Cre+ Class 1 R261G+/+ organoids. J) Top five known HOMER motifs (ranked by p-value) enriched within Cre+, i.e., Class 1 specific AR binding sites. (HOMER, hypergeometric test). K) Fold change and significance of HOMER motifs enriched within Cre+ AR sites over Cre− AR binding sites (HOMER, hypergeometric test). L) Representative multiplex-IF images of CK8, AR, and NSD2 in anterior lobes of FOXA1 Class 1 R265–71del+/+;Trp53f/f tumors. Scale = 100μm. M) Left: Tumor volumes of syngeneic R265–71del+/+;Trp53f/f Cre+ tumor organoids grafted in the subcutaneous flanks of C57BL/6 mice. Right: Representative H&E and multiplex-IF of labeled proteins in tumor allografts obtained from the left panel. Scale =50μm. N) Schematic of castration experiment performed in 60-week-old FOXA1 R265–71del+/+;Trp53f/f mice. O) Transformation score (defined in this paper, see methods) in 60-week-old intact and castrated FOXA1 R265–71del+/+;Trp53f/f prostate tissues (two-sided t-test). Box plot: center line, median; box, interquartile range (Q1–Q3); whiskers, minimum to maximum values; all individual data points shown. P) Prostate cancer score in single-cell RNA-seq from 60-week-old intact and castrated FOXA1 R265–71del+/+;Trp53f/f prostate tissues (two-sided Wilcoxon test).
Fig. 3.
Fig. 3.. FOXA1 Class 2 mutants trigger castration-associated intra-luminal plasticity.
A) ChIP-seq read-density heatmaps of FOXA1 wild-type and Class 2 mutant at 86,000 sites in Class 2 P358fs+/− Cre− and Cre+ organoids. B) Left: UMAP plots of young and old Class 2 P358fs+/− mouse prostate tissues. Two distinct case-specific populations are highlighted in yellow and red. Right: Split UMAP plots with only case or control tissue-derived cells colored across clusters. C) Violin plots of noted signatures in the distinct clusters emanating from the Class 2 case and control prostate tissues. D) Left: UMAP plots of the consensus stemness signature (see Methods) in the Class 2 case and control clusters. Right: Volcano plot of up and down-regulated genes from the case vs control Class 2 single-cell RNA-seq data. Consensus stemness genes are highlighted as purple dots. E) Left: Representative multiplex-IF stained sections of V5 and TROP2 in distinct lobes of 55-week-old Class 2 mutant tissues (Pb-Cre− represents control tissues, and Pb-Cre+ represents case tissues). Scale =100μm. Right: Percentage of AR+/TROP2+ cells in distinct lobes of control and case Class 2 mutant tissues (two-sided t-test). F) Violin plots showing mRNA expression (imputed) of noted genes in the distinct Class 2 case and control-specific clusters. G) Representative multiplex-IF stained sections of V5, TROP2, and AR in 42-week-old Class 2 mutant case and control tissues. Scale=100μm. H) Violin plots of the castration-induced gene signature (defined in-house, see methods) and an L1 gene signature (defined by Kirk et al., 2024) in the Class 2 case and control clusters. I) Boxplots of Nkx3.1 mRNA expression in intact and castrated wild-type prostate tissues (left) and intact FOXA1 Class 2 control and case tissues (right) (two-sided Wilcoxon test). J) Boxplots of distinct gene signature scores in intact FOXA1 Class 2 control and case tissues (top) and castrated or intact wild-type prostate tissues (bottom) (pseudo-bulk analyses from single-cell data, Wilcoxon test). K) Immunoblot of V5 and TROP2 in isogenic Class 2 Cre− (control) and Cre+ (Class 2 mutant expressing) mouse prostate organoids. Total H3 is used as a loading control. L) TROP2 immunofluorescence in Cre− and Cre+ Class 2 mutant mouse prostate organoids. Scale = 100μm. M) Left: Representative images from the limited dilution assay (100 cells/well) in Class 2 Cre− and Cre+ organoids. Right: Percentage of organoids formed in the limited dilution assay at varying cell numbers (n= 3 biological replicates, two-sided t-test). N) Reverse Kaplan-Meier plot of subcutaneous organoid grafting of wild-type, Class 1 or 2 monogenic mouse prostate organoids in CB17/SCID mice.
Fig. 4.
Fig. 4.. FOXA1 Class 2 mutants activate KLF5/AP-1 neo-enhancer circuitry to drive therapy-resistance.
A) Fold change and significance of HOMER motifs enriched within Class 2 neo cis-regulatory elements (CREs) from single-cell multiome ATAC data in Class 2 control and case prostate tissues (HOMER, hypergeometric test). B) Bubble plots highlighting expression and chromVAR motif activity of noted transcription factors from 10X single-cell multi-omics of Class 2 mutant control and case tissues. The size of the dot indicates expression and heatmap color intensity indicates ChromVar activity. C) Venn diagram showing overlap of FOXA1 wild-type and Class 2 mutant cistromes in P358fs+/− Cre− and Cre+ mouse prostate organoids. D) Venn diagram showing overlap of the KLF5 cistrome in Class 2 Cre− and Cre+ mouse prostate organoids. E) ChIP-seq read-density heatmaps of KLF5 and FOXA1 Class 2 mutant at the Class 2-specific, wild-type, or shared sites in the FOXA1 P358fs+/− Cre− and Cre+ mouse prostate organoids. F) Fold change and significance of HOMER motifs enriched at KLF5 and Class 2 mutant co-bound sites (HOMER, hypergeometric test). G) ChIP-seq read-density tracks of the FOXA1 Class 2 mutant and KLF5 within the Jun, Fos, and Bach2 locus in the Class 2 Cre− and Cre+ mouse prostate organoids. H) Growth curves (Cell Titer-Glow) of Cre− and Cre+ Class 2 mutant organoids in DHT-depleted and enzalutamide-treated media conditions (n=4 biological replicates, two-sided t-test). I) Representative multiplex-IF images of CK8 and V5 in the intact and castrated Class 2 mutant (Pb-Cre+) tissues. Scale =100μm. Zoomed insets of select regions are shown. J) Percentage of epithelial cells (CK8+, grey) that are V5+ (green) in intact and castrated Class 2 tissues from panel (I). K) Left: Representative Ki67 IHC stained sections of Class 1 (R265–71del+/+) and Class 2 (P358fs+/−) control and case castrated tissues. Right: Percentage of Ki67+ cells in control, Class 1, and Class 2 tissues (two-sided t-test). Box plot: center line, median; box, interquartile range (Q1–Q3); whiskers, minimum to maximum values; all individual data points shown. L) Boxplots showing KLF5 mRNA expression in metastatic CRPC patient tissues (SU2C, n=371 patients) across distinct genomic driver groups. SU2C, Stand Up To Cancer (Wilcoxon rank-sum test). M) Boxplots showing the KLF5 gene signature (CRPC, top) and Club prostate cancer signature (bottom) in CRPC patient tissues (SU2C, n=371 patients) across distinct genomic driver groups (Wilcoxon rank-sum test).
Fig. 5.
Fig. 5.. Schema depicting distinct oncogenic mechanisms of FOXA1 Class 1 and Class 2 mutations in driving prostate tumorigenesis or therapy-resistant progression.
Normal prostate epithelia comprise three main cell types: terminally differentiated, secretory luminal (Lum) cells, basal cells, and luminal proximal stem-like cells (annotated as LumP, LumC, or Lum2 in published cellular atlases). Overexpression of FOXA1 Class 1 mutants in a p53-deficient prostate epithelium (left) drives formation of androgen-sensitive, invasive prostate adenocarcinoma. This malignant transformation is enabled by the aberrant induction of NSD2, cistromic redistribution of the androgen receptor (AR) at chimeric FOXA1:AR-half enhancer elements, and co-activation of the mTORC1/2 oncogenic pathway. In contrast, overexpression of FOXA1 Class 2 mutants (right) reprograms AR+/CK8+ differentiated luminal epithelial cells to express luminal stemness markers, thereby partially acquiring progenitor-like characteristics. Class 2 mutants induce this intra-luminal plasticity by commissioning a neo-cistrome that is occupied and activated by the AP-1 and KLF5 transcriptional complexes. Class 2-induced luminal stem-like cells (annotated C2-iLumStem) retain AR activity and resist cell death upon castration, suggesting their role in enabling PCa progression following androgen deprivation therapy.

Similar articles

References

    1. Grasso CS, Wu Y-M, Robinson DR, Cao X, Dhanasekaran SM, Khan AP, Quist MJ, Jing X, Lonigro RJ, Brenner JC, Asangani IA, Ateeq B, Chun SY, Siddiqui J, Sam L, Anstett M, Mehra R, Prensner JR, Palanisamy N, Ryslik GA, Vandin F, Raphael BJ, Kunju LP, Rhodes DR, Pienta KJ, Chinnaiyan AM, Tomlins SA, The mutational landscape of lethal castration-resistant prostate cancer. Nature 487, 239–243 (2012). - PMC - PubMed
    1. Cancer Genome Atlas Research Network, The Molecular Taxonomy of Primary Prostate Cancer. Cell 163, 1011–1025 (2015). - PMC - PubMed
    1. Robinson D, Van Allen EM, Wu Y-M, Schultz N, Lonigro RJ, Mosquera J-M, Montgomery B, Taplin M-E, Pritchard CC, Attard G, Beltran H, Abida W, Bradley RK, Vinson J, Cao X, Vats P, Kunju LP, Hussain M, Feng FY, Tomlins SA, Cooney KA, Smith DC, Brennan C, Siddiqui J, Mehra R, Chen Y, Rathkopf DE, Morris MJ, Solomon SB, Durack JC, Reuter VE, Gopalan A, Gao J, Loda M, Lis RT, Bowden M, Balk SP, Gaviola G, Sougnez C, Gupta M, Yu EY, Mostaghel EA, Cheng HH, Mulcahy H, True LD, Plymate SR, Dvinge H, Ferraldeschi R, Flohr P, Miranda S, Zafeiriou Z, Tunariu N, Mateo J, Perez-Lopez R, Demichelis F, Robinson BD, Schiffman M, Nanus DM, Tagawa ST, Sigaras A, Eng KW, Elemento O, Sboner A, Heath EI, Scher HI, Pienta KJ, Kantoff P, de Bono JS, Rubin MA, Nelson PS, Garraway LA, Sawyers CL, Chinnaiyan AM, Integrative clinical genomics of advanced prostate cancer. Cell 161, 1215–1228 (2015). - PMC - PubMed
    1. Tomlins SA, Rhodes DR, Perner S, Dhanasekaran SM, Mehra R, Sun X-W, Varambally S, Cao X, Tchinda J, Kuefer R, Lee C, Montie JE, Shah RB, Pienta KJ, Rubin MA, Chinnaiyan AM, Recurrent fusion of TMPRSS2 and ETS transcription factor genes in prostate cancer. Science 310, 644–648 (2005). - PubMed
    1. Parolia A, Cieslik M, Chu S-C, Xiao L, Ouchi T, Zhang Y, Wang X, Vats P, Cao X, Pitchiaya S, Su F, Wang R, Feng FY, Wu Y-M, Lonigro RJ, Robinson DR, Chinnaiyan AM, Distinct structural classes of activating FOXA1 alterations in advanced prostate cancer. Nature 571, 413–418 (2019). - PMC - PubMed

LinkOut - more resources