

Transposable element expression is associated with sex chromosome number in humans
- PMID: 40570058
- PMCID: PMC12225981
- DOI: 10.1371/journal.pgen.1011668
Transposable element expression is associated with sex chromosome number in humans
Abstract
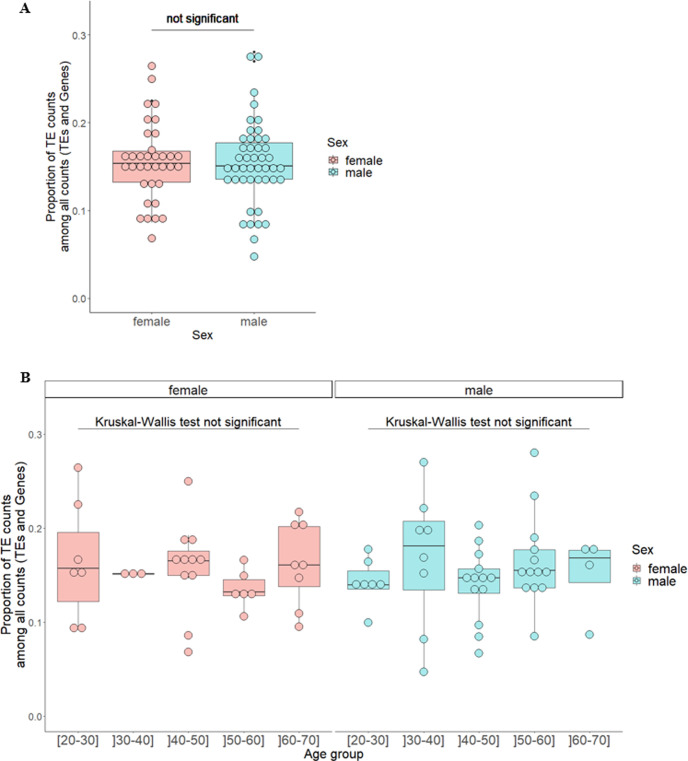
Why women live longer than men is still an open question in human biology. Sex chromosomes have been proposed to play a role in the observed sex gap in longevity, and the Y male chromosome has been suspected of having a potential toxic genomic impact on male longevity. It has been hypothesized that transposable element (TE) repression declines with age, potentially leading to detrimental effects such as somatic mutations and disrupted gene expression, which may accelerate the aging process. Given that the Y chromosome is rich in repeats, age-related increases in TE expression could be more pronounced in males, likely contributing to their reduced longevity compared to females. In this work, we first studied whether TE expression is associated with the number of sex chromosomes in humans. We analyzed blood transcriptomic data obtained from individuals of different karyotype compositions: 46,XX females (normal female karyotype), 46,XY males (normal male karyotype), as well as males with abnormal karyotypes, such as 47,XXY, and 47,XYY. We found that sex chromosomes might be associated to TE expression, with the presence and number of Y chromosomes particularly associated with a global increase in TE expression. This tendency was also observed across several TE subfamilies. We also tested whether TE expression is higher in older males than in older females using published human blood transcriptomic data from the Genotype-Tissue Expression (GTEx) project. However, we did not find increased TE expression in older males compared to older females probably due to the heterogeneity of the dataset. Our findings suggest an association between sex chromosome content and TE expression and open a new window to study the toxic effect of the Y chromosome in human longevity.
Copyright: © 2025 Teoli et al. This is an open access article distributed under the terms of the Creative Commons Attribution License, which permits unrestricted use, distribution, and reproduction in any medium, provided the original author and source are credited.
Conflict of interest statement
The authors have declared that no competing interests exist.
Figures


Similar articles
-
Independent contribution of gonads and sex chromosomes to sex differences in bone mass and strength in the four-core genotypes mouse model.J Bone Miner Res. 2024 Oct 29;39(11):1659-1672. doi: 10.1093/jbmr/zjae147. J Bone Miner Res. 2024. PMID: 39255371
-
Systemic pharmacological treatments for chronic plaque psoriasis: a network meta-analysis.Cochrane Database Syst Rev. 2021 Apr 19;4(4):CD011535. doi: 10.1002/14651858.CD011535.pub4. Cochrane Database Syst Rev. 2021. Update in: Cochrane Database Syst Rev. 2022 May 23;5:CD011535. doi: 10.1002/14651858.CD011535.pub5. PMID: 33871055 Free PMC article. Updated.
-
Signs and symptoms to determine if a patient presenting in primary care or hospital outpatient settings has COVID-19.Cochrane Database Syst Rev. 2022 May 20;5(5):CD013665. doi: 10.1002/14651858.CD013665.pub3. Cochrane Database Syst Rev. 2022. PMID: 35593186 Free PMC article.
-
A rapid and systematic review of the clinical effectiveness and cost-effectiveness of paclitaxel, docetaxel, gemcitabine and vinorelbine in non-small-cell lung cancer.Health Technol Assess. 2001;5(32):1-195. doi: 10.3310/hta5320. Health Technol Assess. 2001. PMID: 12065068
-
Selenium for preventing cancer.Cochrane Database Syst Rev. 2018 Jan 29;1(1):CD005195. doi: 10.1002/14651858.CD005195.pub4. Cochrane Database Syst Rev. 2018. PMID: 29376219 Free PMC article.
References
-
- World Health Organization. Life expectancy at birth (years). 2023. Available: https://www.who.int/data/gho/data/indicators/indicator-details/GHO/life-...
-
- Luy M. Causes of Male Excess Mortality: Insights from Cloistered Populations. Population & Development Rev. 2003;29(4):647–76. doi: 10.1111/j.1728-4457.2003.00647.x - DOI
MeSH terms
Substances
LinkOut - more resources
Full Text Sources
Miscellaneous
