

Examining the overlap in lymphatic filariasis prevalence and malaria insecticide-treated net access-use in endemic Africa
- PMID: 40570066
- PMCID: PMC12201664
- DOI: 10.1371/journal.pntd.0013165
Examining the overlap in lymphatic filariasis prevalence and malaria insecticide-treated net access-use in endemic Africa
Abstract
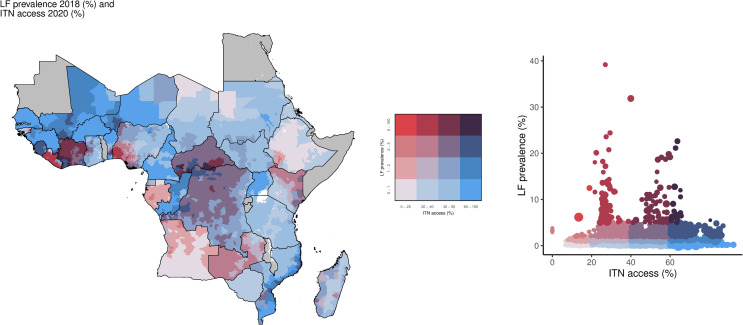
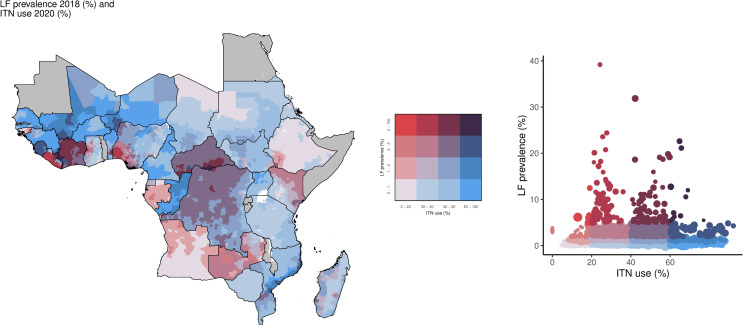
Eradication and elimination strategies for lymphatic filariasis (LF) primarily rely on multiple rounds of annual mass drug administration (MDA), but also may benefit from vector control interventions conducted by malaria vector control programs. We aim to examine the overlap in LF prevalence and malaria vector control to identify potential gaps in program coverage. We used previously published geospatial estimates of LF prevalence from the Institute for Health Metrics and Evaluation, as well as publicly available insecticide-treated net (ITN) access (proportion of the total population with access to ITNs) and use (proportion of the total population that slept under an ITN) estimates among the total population and malaria Plasmodium falciparum parasite rates (PfPR) from the Malaria Atlas Project (MAP). We aggregated the 5x5 km2 estimates of LF prevalence estimates and ITN estimates to the implementation unit (IU) level using fractional aggregation, for 33 LF and malaria-endemic locations in Africa, and then overlaid the IU-level aggregates. In this analysis, ITN coverage was low in areas where LF is common, with 51.7% (90/174) of high-LF-prevalence-IUs having both access and use estimates under 40%. Most (67.8%; 61/90) of these low-ITN-coverage, high-LF-prevalence locations were also categorized as high- or highest-prevalence for malaria by PfPR, suggesting suboptimal ITN coverage even in some malaria-co-endemic locations. Even in IUs with high LF prevalence but low malaria prevalence, almost half (48.2%; 39/81) had high levels of access to ITNs. When accounting for population, however, gaps in ITN access in such areas were evident: more individuals lived in high-LF, low-malaria IUs with low ITN access (8.68 million) than lived in high-LF, low-malaria IUs with high ITN access (6.76 million). These results suggest that relying on current malaria vector control programs alone may not provide sufficient ITN coverage for high LF prevalence areas. Opportunities for coordinated vector control programs in places where LF and malaria prevalence are high but ITN coverage is low - or additional ITN distribution in high-LF, low-malaria locations - should be explored to help achieve elimination goals.
Copyright: © 2025 Whisnant et al. This is an open access article distributed under the terms of the Creative Commons Attribution License, which permits unrestricted use, distribution, and reproduction in any medium, provided the original author and source are credited.
Conflict of interest statement
I have read the journal's policy and the authors of this manuscript have the following competing interests: EC reports payment or honoraria for lectures, presentations, speakers, bureaus, manuscript writing or educational events from the Royal Holloway University of London, and support for attending meetings and/or travel from the Bill and Melinda Gates Foundation; outside the submitted work. JFM reports grant funding from Gavi and support for attending meetings and/or travel from Bill and Melinda Gates Foundation; outside the submitted work.
Figures


Similar articles
-
Indoor residual spraying for preventing malaria in communities using insecticide-treated nets.Cochrane Database Syst Rev. 2022 Jan 17;1(1):CD012688. doi: 10.1002/14651858.CD012688.pub3. Cochrane Database Syst Rev. 2022. PMID: 35038163 Free PMC article.
-
Indoor residual spraying for preventing malaria.Cochrane Database Syst Rev. 2010 Apr 14;2010(4):CD006657. doi: 10.1002/14651858.CD006657.pub2. Cochrane Database Syst Rev. 2010. PMID: 20393950 Free PMC article.
-
Topical repellents for malaria prevention.Cochrane Database Syst Rev. 2023 Aug 21;8(8):CD015422. doi: 10.1002/14651858.CD015422.pub2. Cochrane Database Syst Rev. 2023. PMID: 37602418 Free PMC article.
-
Primaquine for reducing Plasmodium falciparum transmission.Cochrane Database Syst Rev. 2012 Sep 12;(9):CD008152. doi: 10.1002/14651858.CD008152.pub2. Cochrane Database Syst Rev. 2012. Update in: Cochrane Database Syst Rev. 2014 Jun 30;(6):CD008152. doi: 10.1002/14651858.CD008152.pub3. PMID: 22972117 Updated.
-
High exposure to malaria vector bites despite high use of bednets in a setting of seasonal malaria in southwestern Mali: the urgent need for outdoor vector control strategies.Parasit Vectors. 2025 Jul 9;18(1):274. doi: 10.1186/s13071-025-06818-8. Parasit Vectors. 2025. PMID: 40635025 Free PMC article.
References
-
- World Health Organization. Global programme to eliminate lymphatic filariasis: progress report, 2021 [Internet]. WHO; 2022. [cited 2023 Sep 14]. Available from: https://www.who.int/publications/i/item/who-wer9741-513-524
-
- World Health Organization. Ending the neglect to attain the Sustainable Development Goals: A road map for neglected tropical diseases 2021–2030 [Internet]. WHO; 2021. [cited 2023 Sep 14]. Available from: https://www.who.int/publications/i/item/9789240010352
-
- United Nations Department of Economic and Social Affairs. The Sustainable Development Goals Report 2023: Special Edition [Internet]. United Nations; 2023. Jul [cited 2023 Sep 18]. Available from: https://www.un-ilibrary.org/content/books/9789210024914
-
- World Health Organization. Lymphatic filariasis. [cited 2023 September 18]. Available from: https://www.who.int/news-room/fact-sheets/detail/lymphatic-filariasis
MeSH terms
LinkOut - more resources
Full Text Sources
Medical
