. 2025 Jul 9;73(27):17040-17056.
doi: 10.1021/acs.jafc.5c05877. Epub 2025 Jun 26.

Mechanistic Elucidation of Tricholoma mongolicum Polysaccharides in Treating MAFLD via Regulation of the Gut Microbiota-Metabolite-Ferroptosis Axis: A Multi-Omics Perspective

Affiliations

Mechanistic Elucidation of Tricholoma mongolicum Polysaccharides in Treating MAFLD via Regulation of the Gut Microbiota-Metabolite-Ferroptosis Axis: A Multi-Omics Perspective

Chunli Ma et al. J Agric Food Chem. .

Abstract

This study aimed to elucidate the modulatory effects and underlying molecular mechanisms of Tricholoma mongolicum polysaccharide (TMP) in the context of metabolic dysfunction-associated fatty liver disease (MAFLD). High-performance gel permeation chromatography (HPGPC) analysis indicated a bimodal molecular weight distribution. Monosaccharide composition profiling revealed a predominance of glucose and galactose among other constituents. Scanning electron microscopy (SEM) illustrated a porous, aggregated colloidal microstructure. In a model of MAFLD, TMP intervention significantly attenuated serum levels of TC, TG, and AST, ALT, accompanied by notable histological improvements, including reduced hepatic steatosis and inflammatory cell infiltration. Metagenomic analysis demonstrated that TMP substantially enhanced gut microbial α-diversity, restructured microbial community composition, decreased the Firmicutes/Bacteroidetes ratio, enriched SCFAs-producing genera, and suppressed the excessive proliferation of pro-inflammatory bacterial genera. Integrated proteomic and lipidomic analyses revealed that TMP inhibited hepatic immune-inflammatory responses and ferroptosis pathways, enhanced pathways associated with metabolic homeostasis. Furthermore, TMP modulated hepatic iron metabolism by upregulating the Nrf2/GPx4 antioxidant axis and FPN1 while downregulating TFR1, thereby alleviating oxidative stress and iron overload. These findings demonstrate that TMP exerts therapeutic efficacy through a bidirectional gut-liver regulatory mechanism involving microbial modulation, ferroptosis inhibition, metabolic reprogramming, and activation of antioxidant defenses. This research provides novel insights and molecular targets for the development of natural polysaccharide-based interventions for MAFLD.

Keywords: Tricholoma mongolicum polysaccharide; bidirectional gut−liver axis regulation; ferroptosis; gut microbiota; metabolic dysfunction-associated fatty liver disease; multiomics.


Figures

1
1
Process of TMP extraction and purification.
2
2
Characterization of TMP. (A) HPGPC chromatogram of TMP. The retention time of TMP is inversely correlated with molecular weight, and the peak area correlates with the relative content of the corresponding molecular fraction. (B) FT-IR spectrum of TMP. The characteristic absorption peaks at 3200–3600, 2927, 1637, and 1000–1200 cm–1 correspond to hydroxyl (O–H) stretching vibrations, alkyl (C–H) stretching, carbonyl (CO) or olefinic (CC) double bonds, and glycosidic (C–O–C) bond stretching, respectively. (C) Ion chromatography of TMP. The above ion chromatogram illustrates 16 standard monosaccharides, while the one below depicts the composition of TMP monosaccharide. (D–F) Imaging diagrams of TMP using SEM at various magnification levels.
3
3
Effects of TMP on high-fat diet-induced MAFLD mice. (A) The serum total cholesterol (TC) levels. (B) The serum total triglyceride (TG) levels. (C) The low-density lipoprotein cholesterol (LDL-C) levels; (D) The high-density lipoprotein cholesterol (HDL-C) levels. (E) The serum aspartate aminotransferase (AST) levels. (F) The serum alanine aminotransferase (ALT) levels. (G) H&E staining of liver tissue. The hepatocytes in the model group displayed marked signs of ballooning degeneration, characterized by enlarged and irregular cell shapes when compared to the control group. Moreover, the severity of these pathological features was significantly mitigated in the TMP intervention group. (H) Masson staining of liver tissue. (n = 6;*p < 0.05, ** p < 0.01, *** p < 0.001, ns: not significant).
4
4
Effects of TMP on the structure of gut microbiota in MAFLD mice (n = 6). (A, B) Comparison of gut microbiota α diversity using Observed species and Chao1 indices. (** p < 0.01.) (C) Venn diagram depicting the distribution of gut microbiota species among the control, model, and TMP intervention groups. (D) Principal coordinates analysis (PCoA) of gut microbiota structure data among the control, model, and TMP intervention groups. (E) Hierarchical clustering analysis at the OTU level.
5
5
Effects of TMP on the composition of gut microbiota in MAFLD mice (n = 6). (A) Relative abundance at the phylum level. (B) Heatmap of the top 10 most abundant phyla. (C) Relative abundance at the genus level. (D) Heatmap of the top 10 most abundant genera. (E) LDA histogram based on LEfSe analysis (LDA > 4 is considered a taxon with different features).
6
6
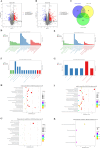
Proteomic analysis of TMP intervention in MAFLD (n = 3). (A) Volcano map of differentially expressed proteins in the model group. (B) Volcano map of differentially expressed proteins in the TMP group. (C) Venn Diagram. (D–G) GO enrichment analysis results: (D) GO enrichment of proteins upregulated in the model group. (E) GO enrichment of proteins downregulated in the model group. (F) GO enrichment of proteins downregulated in the TMP group; (G) GO enrichment of proteins upregulated in the TMP group. The enrichment analysis of the model group focused on the top 30 significantly enriched terms, including the top 10 items selected from biological process (BP), cellular component (CC), and molecular function (MF) categories, respectively. In the TMP group, all significantly enriched items in BP, CC, and MF categories were presented. (H–K) KEGG pathway enrichment analysis: (H) KEGG enrichment of upregulated proteins in the high-fat diet group; (I) KEGG enrichment of downregulated proteins in the high-fat diet group. (J) KEGG enrichment of downregulated proteins in the TMP group; (K) KEGG enrichment of upregulated proteins in the TMP group. For the model group, the top 20 enriched pathways were listed, while all enriched pathways were listed for the TMP group. The x-axis (Enrichment Score) represents the enrichment score, and the y-axis denotes the top 20 pathways. Larger bubbles signify a greater number of differentially expressed proteins. The bubble color transitions from red to green to blue to purple, with smaller enrichment p-values indicating higher levels of significance.
7
7
Metabolomic analysis of TMP intervention in MAFLD (n = 3). (A) Bar chart of differential metabolites. (B) Volcanic maps of differentially expressed metabolites between the model and control groups. (C) Heatmaps of top 50 differential metabolites between the model and control groups. (D) Volcano map of differentially expressed metabolites between the TMP and model groups. (E) Heatmaps of top 50 differential metabolites between the TMP and model groups. (F) Pathway enrichment of differential metabolites between the model and control groups. (G) Pathway enrichment of differential metabolites between the TMP and model groups. The y-axis indicates the pathway names, and the x-axis represents the enrichment factor (Rich factor = number of significantly changed metabolites/total number of metabolites in the pathway). A higher Rich factor denotes greater enrichment. Color from green to red represents decreasing p-values. Larger dots stand for more metabolites enriched in the pathway.
8
8
Protective effects of TMP on ferroptosis in hepatocytes. (A) SOD activity assay. (B) MDA content assay. (C) Flow cytometry analysis of ROS levels. MFI: Mean Fluorescence Intensity. (D) Flow cytometry analysis of lipid peroxidation, MFI: Mean Fluorescence Intensity. (E) Western blot analysis of GPx4 and ACSL4 expression in hepatocytes. (F) qPCR analysis of iron regulatory proteins (FPN1, TFR1) and FTH1 mRNA expression. (n = 3, * p < 0.05, **p < 0.01, ***p < 0.001, ns: not significant).
9
9
Effects of TMP on ferroptosis in liver tissue. (A) The levels of MDA in liver homogenate. (B) The SOD activity in liver homogenate. (C) The levels of GSH in liver homogenate. (D) The levels of GPx4 in liver homogenate. (E) Western blot analysis of GPx4 and ACSL4 expression in liver tissue. (F) The immunohistochemical staining and quantified results of ACSL4, FTH1, GPx4, and Nrf2 in liver sections from the control, model, and TMP treatment groups are presented. The localization and expression levels of the proteins are visualized through brown staining. (G) Prussian blue staining in liver sections from the control, model, and TMP treatment groups. The positive staining appears as blue precipitates, indicating the presence and distribution of iron. (n = 3, *p < 0.05, **p < 0.01, ***c 0.001, ns: not significant).
10
10
Impact of TMP-containing serum on ferroptosis in hepatocytes. (A) The levels of MDA in serum; (B) The SOD activity in serum; (C) The levels of GPx4 in serum; (D) Flow cytometry analysis of ROS levels.MFI: Mean Fluorescence Intensity. (E) Flow cytometry analysis of lipid peroxidation. MFI: Mean Fluorescence Intensity. CS: Control serum, DCS: Drug containing serum. (n = 3, *P < 0.05, **P < 0.01, ***P < 0.001, ns: not significant).
11
11
Correlation analysis. (A) The correlation between gut microbiota and metabolites in the model group. (B) The correlation between the intestinal flora and metabolites in the TMP group. (C) The correlation between the intestinal flora and the related indicators of oxidative stress ferroptosis in the model group. (D) The correlation between the intestinal microbiota in the TMP group and the related indicators of oxidative stress ferroptosis. (n = 6, *p < 0.05, ** p < 0.01, *** p < 0.001, ns: not significant).

Similar articles

References

    1. Wu X., Arya R. K., Huang E., McMullen M. R., Nagy L. E.. Receptor-interacting protein 1 and 3 kinase activity are required for high-fat diet induced liver injury in mice. Front. Endocrinol. 2023;14:1267996. doi: 10.3389/fendo.2023.1267996. - DOI - PMC - PubMed
    1. Kozumi K., Kodama T., Murai H., Sakane S., Govaere O., Cockell S., Motooka D., Kakita N., Yamada Y., Kondo Y., Tahata Y., Yamada R., Hikita H., Sakamori R., Kamada Y., Daly A. K., Anstee Q. M., Tatsumi T., Morii E., Takehara T.. Transcriptomics Identify Thrombospondin-2 as a Biomarker for NASH and Advanced Liver Fibrosis. Hepatology. 2021;74:2452–2466. doi: 10.1002/hep.31995. - DOI - PMC - PubMed
    1. Yip T. C., Wong G. L., Wong V. W., Goh G. B., Chan W. K.. Nonalcoholic Fatty Liver Disease: A Unique Entity or Part of the Metabolic Syndrome or Both. Med. Clin. North Am. 2023;107:449–463. doi: 10.1016/j.mcna.2022.12.003. - DOI - PubMed
    1. Enjoji M., Yasutake K., Kohjima M., Nakamuta M.. Nutrition and nonalcoholic Fatty liver disease: the significance of cholesterol. Int. J. Hepatol. 2012;2012:925807. doi: 10.1155/2012/925807. - DOI - PMC - PubMed
    1. Kumar A., Sharma A., Duseja A., Das A., Dhiman R. K., Chawla Y. K., Kohli K. K., Bhansali A.. Patients with Nonalcoholic Fatty Liver Disease (NAFLD) have Higher Oxidative Stress in Comparison to Chronic Viral Hepatitis. J. Clin. Exp. Hepatol. 2013;3:12–18. doi: 10.1016/j.jceh.2012.10.009. - DOI - PMC - PubMed

MeSH terms