. 2025 Jul 22;105(2):e213644.
doi: 10.1212/WNL.0000000000213644. Epub 2025 Jun 26.

Phenotypic Spectrum in Individuals With Pathogenic GABRG2 Loss- and Gain-of-Function Variants

Affiliations

Phenotypic Spectrum in Individuals With Pathogenic GABRG2 Loss- and Gain-of-Function Variants

Alessandra Rossi et al. Neurology. .

Abstract

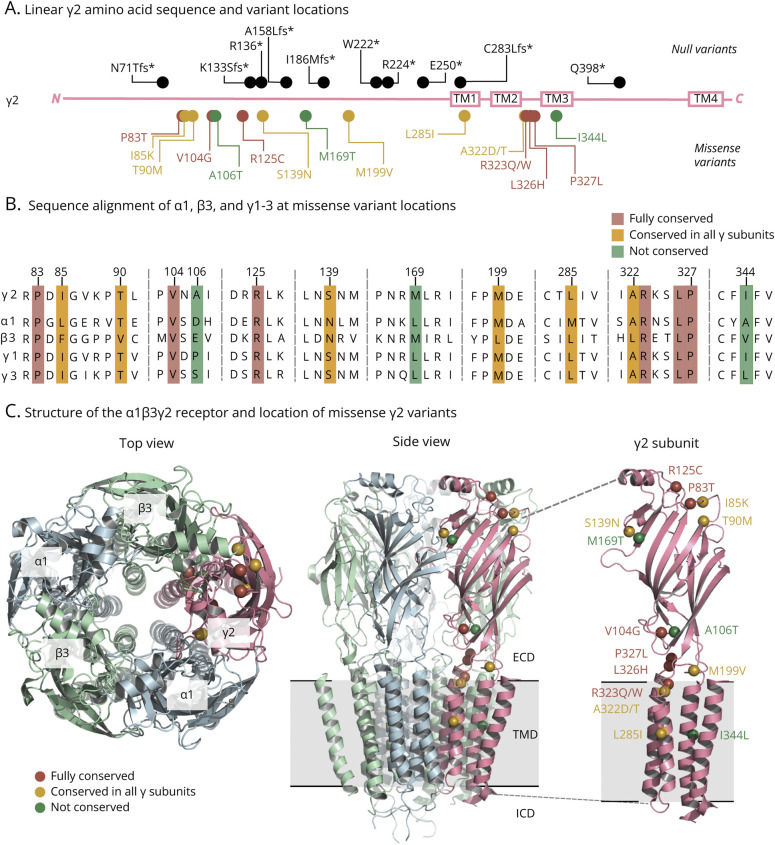
Background and objectives: Variants in the GABRG2 gene encoding the γ2 subunit of the γ-aminobutyric acid type A (GABAA) receptor are associated with a spectrum of epilepsy phenotypes. These range from simple febrile seizures to more severe conditions, including developmental and epileptic encephalopathies (DEEs). Despite previous analyses suggesting that pathogenic variants may lead to loss-of-function (LoF) receptors, a correlation between functional analysis and clinical phenotypic diversity remains elusive. We, therefore, aimed to determine why variants in the GABRG2 gene can lead to highly diverse phenotypes.

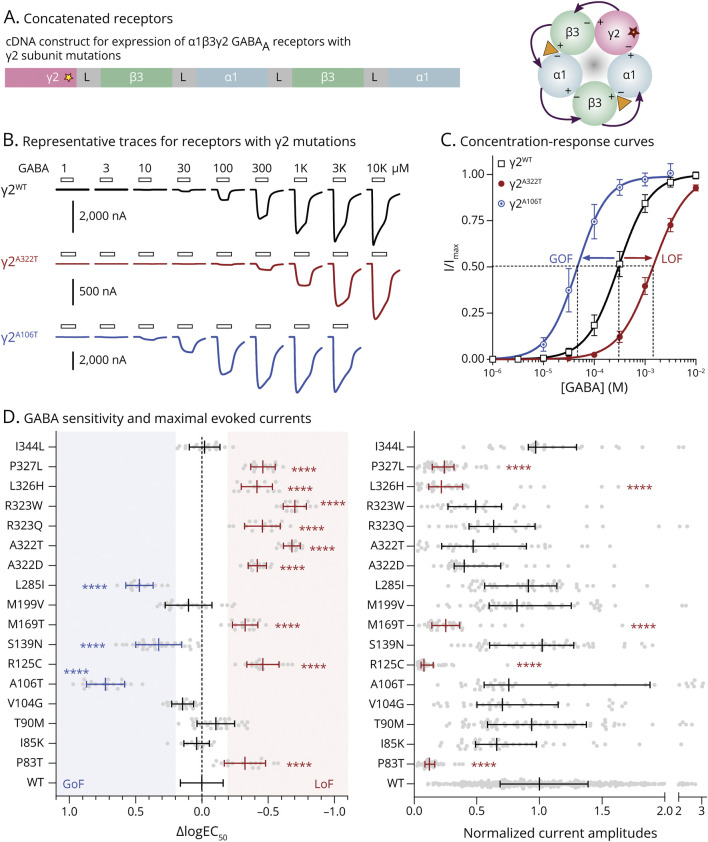
Methods: We assembled a cohort of unreported probands carrying presumed pathogenic GABRG2 variants. Electroclinical information was systematically collected, and electrophysiologic measurements were conducted for missense variants to explore potential alterations in receptor function.

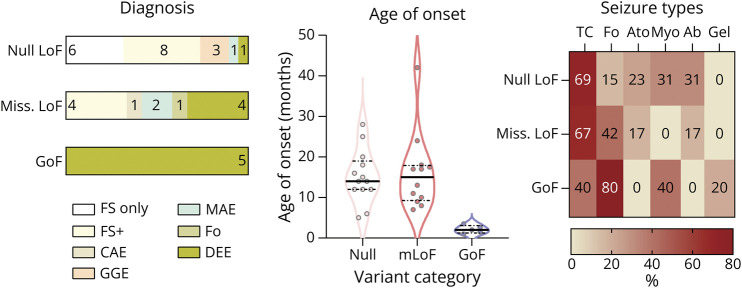
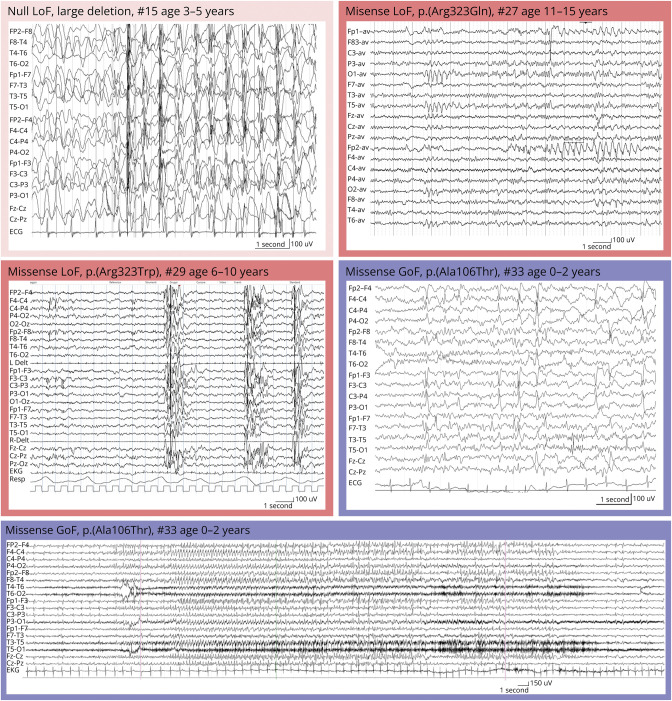
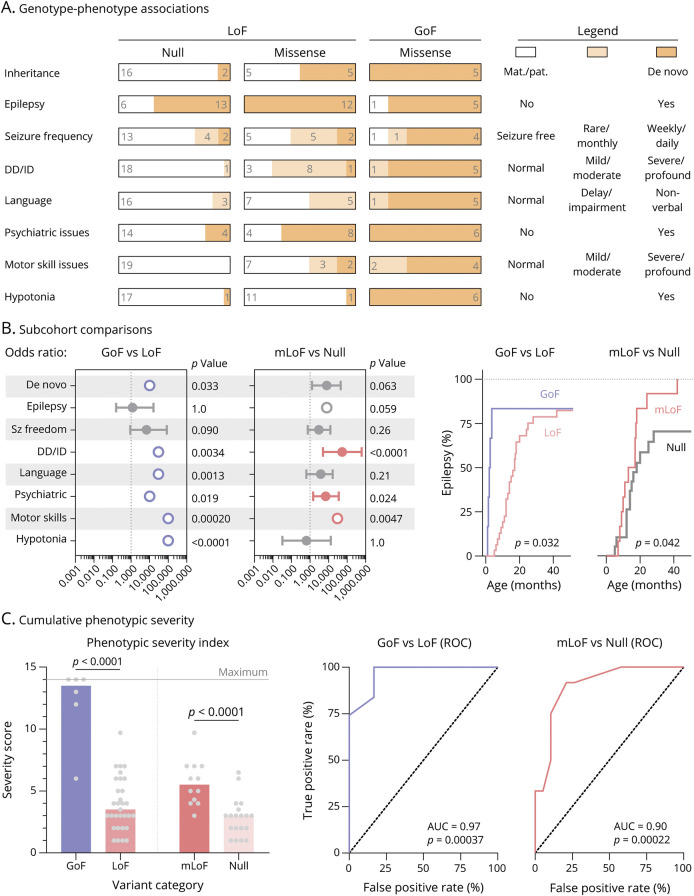
Results: We examined 44 individuals with 35 GABRG2 variants (18 null and 17 missense). Functional assessments of the missense variants revealed that 9 caused LoF and 3 caused gain-of-function (GoF). The remaining 5 did not alter receptor function and are likely not pathogenic. Based on functional analysis and electroclinical data, 37 affected individuals were categorized into 3 groups: null LoF, missense LoF, and GoF variants. Among 19 individuals with null variants, epilepsy was diagnosed in 13, with a median onset of 14 months. The remaining 6 of 19 only had febrile seizures. Developmental delay/intellectual disability (DD/ID) was observed in 1 of 19 and psychiatric features in 4 of 18. By contrast, all 12 individuals with missense LoF variants suffered from epilepsy with a median onset of 15 months. Most common epilepsy diagnoses were febrile seizures plus in 4 of 12 and DEE in 4 of 12. DD/ID affected 9 of 12, and psychiatric features were diagnosed in 8 of 12. Statistical comparisons revealed that null variants were associated with a milder phenotype than missense LoF variants. Finally, 5 of 6 individuals with GoF variants had DEE characterized by early infancy onset at 2 months and severe/profound DD/ID. The sixth individual exhibited mild DD/ID and hypotonia without seizures.

Discussion: Our findings indicate that the severity of disease associated with pathogenic GABRG2 variants depends on the functional consequences of the variants. Null variants are associated with a mild phenotype and missense LoF variants with an intermediate phenotype while GoF variants can lead to severe phenotypes.


Conflict of interest statement

The authors report no relevant disclosures. Go to Neurology.org/N for full disclosures.

Figures

Figure 1
Figure 1. Structural Location of GABRG2 Variants
(A) 2D representation of the amino acid sequence of the GABAAR γ2 subunit peptide with the location of null variants and missense variants. Transmembrane regions are represented as open boxes. (B) Sequence alignments of γ1-3 with α1 and β3 subunits in the immediate vicinity of missense variants with the indicated color scheme. (C) 3D representation of the α1β3γ2 GABAAR (pdb:6hup) with the location of assessed missense γ2 variants displayed as spheres. Red spheres represent variants with complete sequence identity across all main GABAA receptor subunits, yellow spheres with sequence identity across γ1-3 subunits, and green spheres with limited sequence identity across GABAAR subunits. GABAA = γ-aminobutyric acid type A.
Figure 2
Figure 2. Functional Analysis of α1β3γ2 GABAARs Containing γ2 Mutations
(A) The concatenated pentameric γ2-β3-α1-β3-α1 cDNA construct used for functional analysis is illustrated with 4 linkers (L, gray) and resulting expressed fusion protein viewed from the extracellular side. A yellow star indicates that γ2 subunit mutations are entered in the 1st subunit position. (B) Representative traces depict concentration-response relationships for the wild-type α1β3γ2 receptor and receptors containing the γ2A322T and γ2A106T mutations. Bars above traces designate the 25-second application time and GABA concentrations. (C) Normalized GABA concentration-response relationships were plotted as a function of the GABA concentration, and the Hill equation was fitted to each data set by nonlinear regression (eTable 1). Data points are presented as mean ± SD for n = 12–13 independent experiments. Dotted lines indicate the concentrations that lead to half-maximal activation (EC50) for each receptor type. Arrows indicate whether a variant caused increased (GoF) or a decreased (LoF) GABA sensitivity. (D, left) The difference in GABA sensitivity between wild-type and 17 mutated receptors was calculated from the logarithmic conversion of EC50 values (ΔlogEC50) on each experimental day. Final ΔlogEC50 data sets for each variant contain data from n = 12–29 independent experiments and are presented as mean ± SD with individual data points (eTable 1). Blue indicates mutations with significantly increased sensitivity to GABA, red indicates variants with significantly decreased GABA sensitivity, and gray indicates mutations with no significant change. Significance was determined by one-way ANOVA (F< (17, 460) = 120; p < 0.0001) with the Dunnett post hoc test (****p < 0.0001). The transparent blue and red areas indicate the typical areas wherein mutated receptors show significance. (D, right) Normalized maximal GABA-evoked current amplitudes are presented as median with interquartile ranges (IQRs) for n = 388 (WT) or n = 27–65 (γ2 mutations) experiments. Red indicates mutations causing LoF while black indicates mutations with no significant change. Significance was determined using the Mann-Whitney test (****p < 0.0001).
Figure 3
Figure 3. Epilepsy Features for Individuals With Null LoF, Missense LOF and GoF GABRG2 Variants
Epilepsy diagnosis percentages are presented as horizontal slices for individuals carrying null LoF (n = 19), missense LoF (n = 12), and GoF (n = 5) variants. Age at seizure onset is presented as a violin plot for individuals diagnosed with epilepsy (not FSs) for the 3 groups of variants. Null signifies null LoF variants, and mLoF signifies missense LoF variants. Median values are indicated by solid lines and IQRs by dotted lines. Most common seizure types are presented as a heat map for the 3 groups of variants. The percentage of individuals with each seizure type is indicated by numbers inside the rectangles. Seizure types: Ab = typical absences; Ato = atonic; Fo = focal; Gel = gelastic; GoF = gain-of-function; LoF = loss-of-function; Myo = myoclonic; and TC = tonic-clonic.
Figure 4
Figure 4. Representative EEGs From Individuals Carrying LoF or GoF Variants
Slow background activity, with generalized high-amplitude 3–4-Hz activity/spike and slow waves, was observed in an individual (#15) with a null LoF variant. Preserved background activity with asynchronous runs of spike-wave discharges in the left temporo-occipital and right anterior regions was observed in an individual (#27) harboring a missense LoF variant. Bilateral spike abnormalities in bilateral frontocentral regions, with right predominance and diffuse burst of irregular spike-wave discharges, were observed in an individual (#29) with a missense LoF variant. Disorganized background activity with intermixed multifocal epileptiform abnormalities (spikes and sharp waves) was observed in an individual (#33) with a missense GoF variant. Ictal EEG of a gelastic seizure in individual #33 shows that onset of the ictal discharge is in the right frontocentral region with bilateral spreading. GoF = gain-of-function; LoF = loss-of-function.
Figure 5
Figure 5. Genotype-Phenotype Associations for Individuals With Null LoF, Missense LoF, and GoF GABRG2 Variants
(A) Phenotypic feature percentages are presented as horizontal slices for individuals carrying null LoF (n = 19), missense LoF (n = 12), and GoF (n = 6) variants where available. The number of individuals with each feature is indicated, and the legend defines the meaning of the color coding for each feature. All displayed clinical information is extracted from eTable 1. (B) Odds ratio (OR) analyses of phenotype-genotype associations are presented, with the center circle denoting the OR with 95% CI. Light blue indicates significant enrichment in individuals with GoF variants. Light red indicates significant enrichment in individuals with missense LoF (mLoF) variants. Gray indicates no significant difference (p > 0.05) between compared subgroups. Open circles without CIs indicate data where 1 category contains 0 or 100% of individuals, which means that the OR and CI cannot be determined. Statistical analyses were performed using the two-sided Fisher exact test with indicated p values. Statistics for epilepsy incidence were performed using the Mantel-Cox test with indicated p values. (C) As described in the methods, the cumulative phenotypic severities for individuals with the indicated subgroup of variants were calculated by assigning scores to each of the 9 phenotypic features depicted in Figure 5B. The maximum possible severity score of 14 is indicated by a gray line. Statistical analysis comparing the subgroups was performed using the Mann-Whitney test with indicated p values. A ROC curve comparing the true-positive and false-positive rates at different values of the severity index is shown comparing GoF and LoF variants and null and mLoF variants. The area under the curve is indicated, and statistical analysis comparing the subgroups was performed using the Wilson-Brown test with indicated p values. GoF = gain-of-function; LoF = loss-of-function.

Similar articles

References

    1. Epi25 Collaborative Electronic address s berkovic@unimelb edu auEpi25 Collaborative. Ultra-rare genetic variation in the epilepsies: a whole-exome sequencing study of 17,606 individuals. Am J Hum Genet. 2019;105(2):267-282. doi: 10.1016/j.ajhg.2019.05.020 - DOI - PMC - PubMed
    1. Wallace RH, Marini C, Petrou S, et al. Mutant GABA(A) receptor gamma2-subunit in childhood absence epilepsy and febrile seizures. Nat Genet. 2001;28(1):49-52. doi: 10.1038/ng0501-49 - DOI - PubMed
    1. Baulac S, Huberfeld G, Gourfinkel-An I, et al. First genetic evidence of GABA(A) receptor dysfunction in epilepsy: a mutation in the gamma2-subunit gene. Nat Genet. 2001;28(1):46-48. doi: 10.1038/ng0501-46 - DOI - PubMed
    1. Audenaert D, Schwartz E, Claeys KG, et al. A novel GABRG2 mutation associated with febrile seizures. Neurology. 2006;67(4):687-690. doi: 10.1212/01.wnl.0000230145.73496.a2 - DOI - PubMed
    1. Boillot M, Morin-Brureau M, Picard F, et al. Novel GABRG2 mutations cause familial febrile seizures. Neurol Genet. 2015;1(4):e35. doi: 10.1212/nxg.0000000000000035 - DOI - PMC - PubMed