. 2025 Jul 22;44(7):115909.
doi: 10.1016/j.celrep.2025.115909. Epub 2025 Jun 25.

Cytokine-induced reprogramming of human macrophages toward Alzheimer's disease-relevant molecular and cellular phenotypes in vitro

Affiliations

Cytokine-induced reprogramming of human macrophages toward Alzheimer's disease-relevant molecular and cellular phenotypes in vitro

Anna Podleśny-Drabiniok et al. Cell Rep. .

Abstract

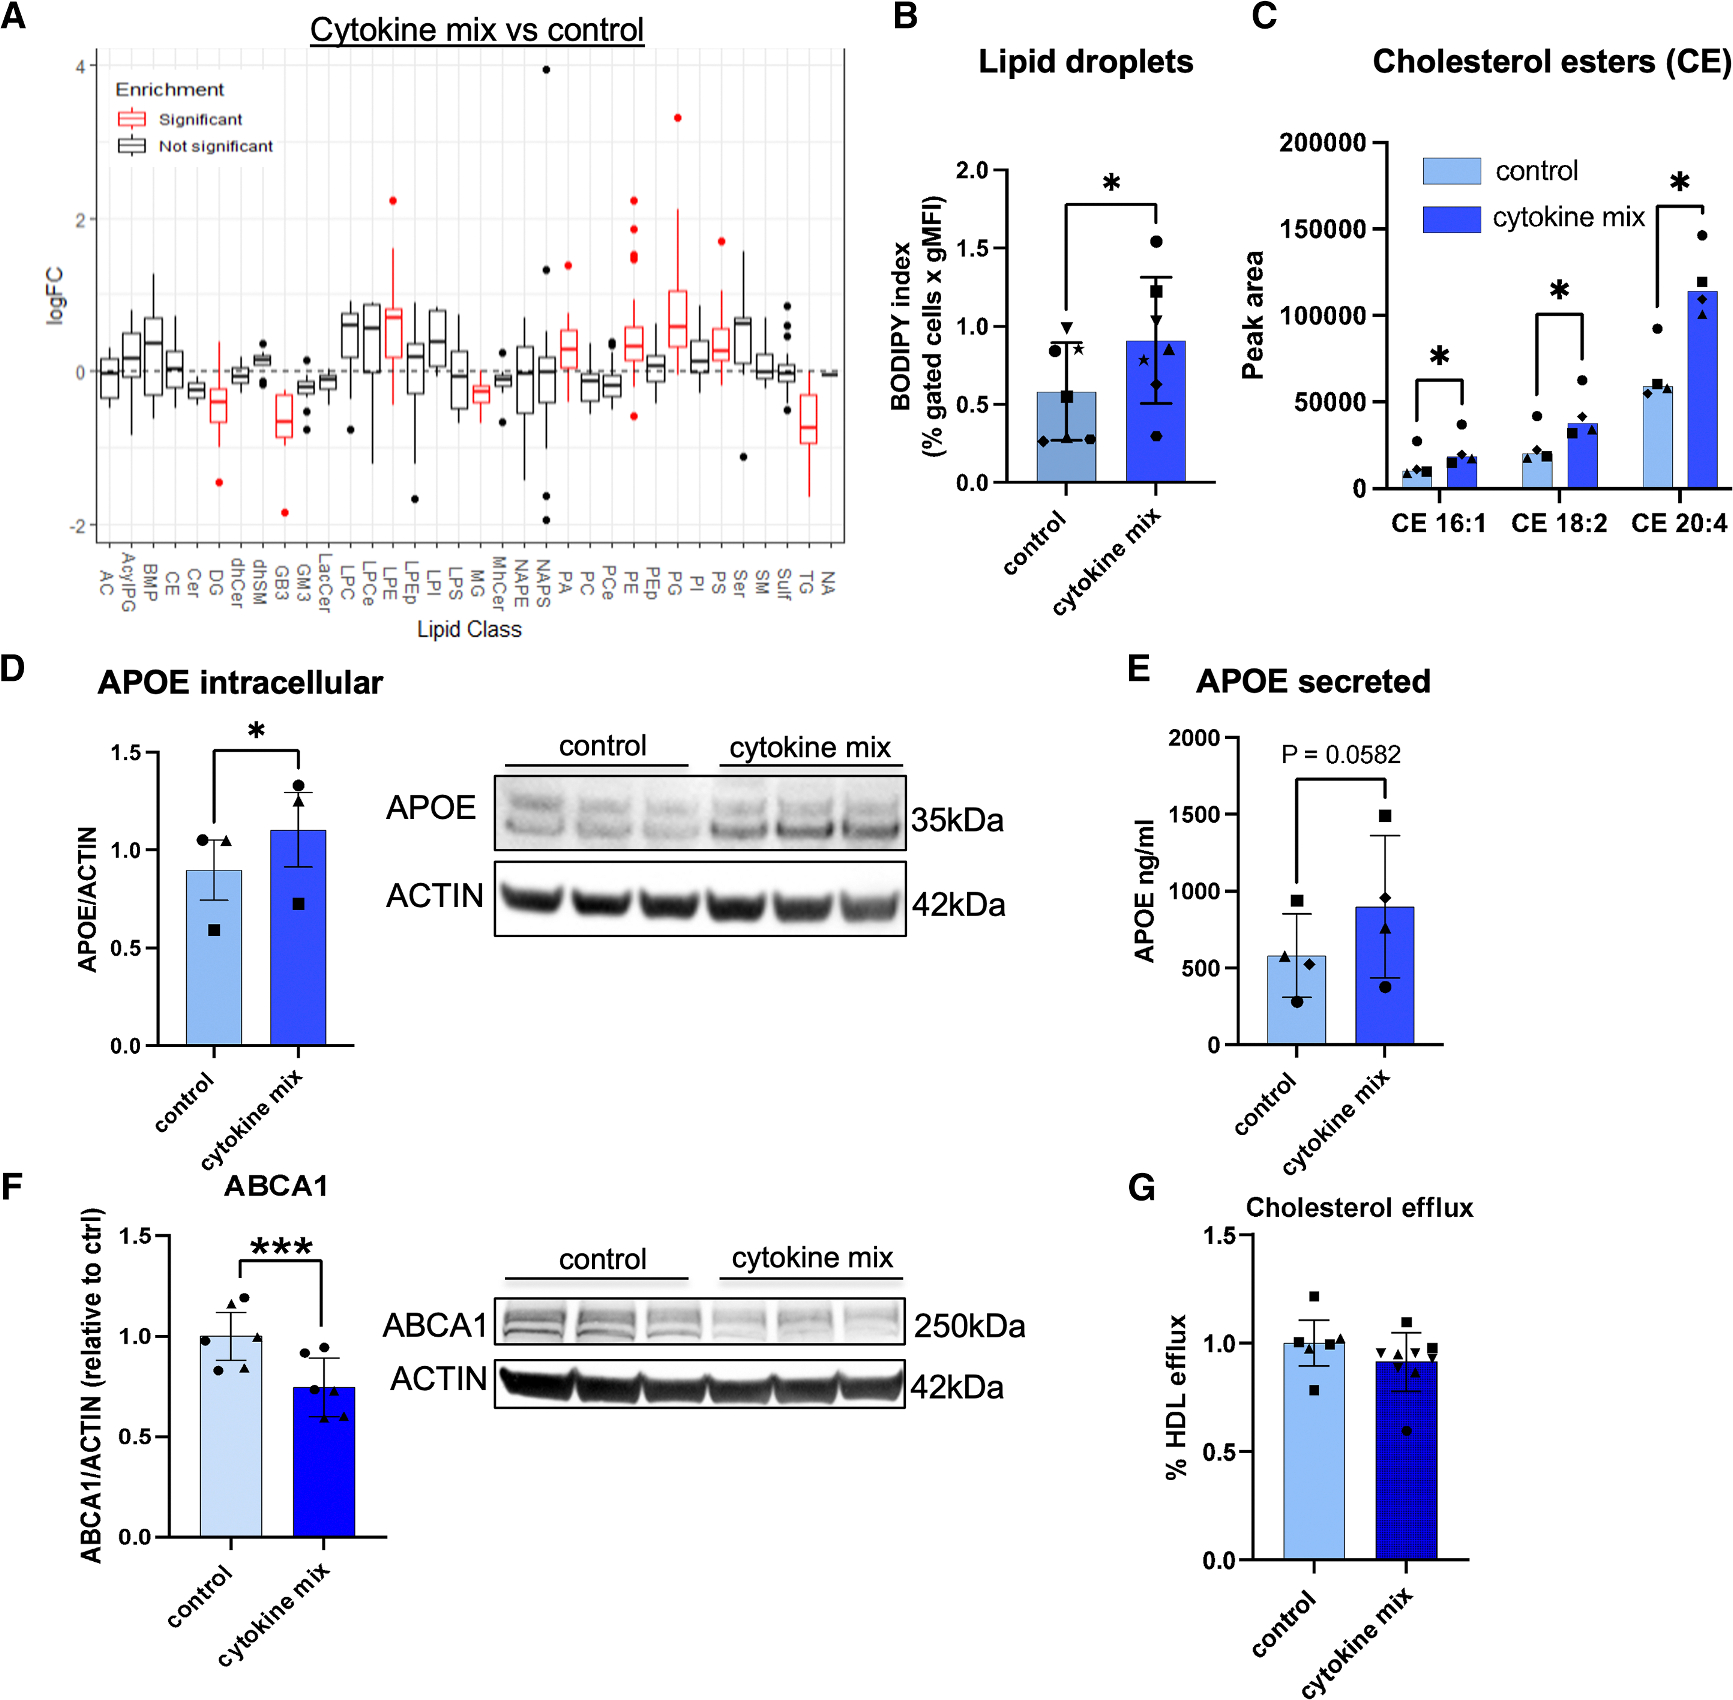
Myeloid cells, including brain-resident microglia and peripheral macrophages, play key roles in neurodegenerative diseases such as Alzheimer's disease (AD). Studying their disease-associated states is limited by the lack of robust in vitro models. Here, we test whether a cytokine mix (interleukin [IL]-4, CSF1, IL-34, and transforming growth factor-β) reprograms human THP-1 macrophages toward AD-relevant phenotypes. This treatment induces significant transcriptomic changes, driving THP-1 macrophages toward a transcriptional state reminiscent of disease-associated microglia and lipid-associated macrophages (LAM), collectively referred to as DLAM. Transcriptome profiling reveals gene expression changes related to oxidative phosphorylation, lysosome function, and lipid metabolism. Single-cell RNA sequencing shows an increased proportion of DLAM clusters in cytokine mix-treated THP-1 macrophages. Functional assays demonstrate alterations in cell motility, phagocytosis, lysosomal activity, and metabolic profiles. These findings provide insights into cytokine-mediated reprogramming of macrophages toward disease-relevant states, highlighting their role in neurodegenerative diseases and potential for therapeutic development.

Keywords: Alzheimer’s disease; CP: Immunology; CP: Neuroscience; DAM; IL-4; LAM; THP-1 macrophages; disease-associated microglia; efferocytosis; lipid-associated macrophages.


Conflict of interest statement

Declaration of interests A.M.G.: Scientific Advisory Board (SAB) Genentech; SAB Muna Therapeutics; E.M.: consultant Dorian Therapeutics, Turn Biotechnologies.

Figures

Figure 1.
Figure 1.. Differential abundance and pathway enrichment analysis of gene expression changes induced by cytokine treatment in THP-1 macrophages reveals changes in Lysosome, Oxidative phosphorylation and Cell cycle
(A) Schematic of THP-1 differentiation using phorbol 12-myristate 14-acetate (PMA) followed by cytokine treatment. (B) Principal component analysis (PCA) comparing THP-1 macrophages (with and without cytokines) with other myeloid cell types. (C) Kyoto Encyclopedia of Genes and Genomes (KEGG)-selected pathways from GSEA positively enriched in three main cytokines group as compared with no cytokine (controls) (for all GSEA, see Table S1). (D) Volcano plots representing top differentially expressed genes in cytokine-treated macrophages.
Figure 2.
Figure 2.. Cytokine treatment induces a DLAM and non-proliferative transcriptional response in THP-1 macrophages
(A) Enrichment of AD-related gene sets in cytokine-treated macrophages. All gene sets are listed in Table S2. NES, normalized enrichment score. False discovery rate q-values are listed in Table S2. (B) Heatmap of DLAM genes Z-scores (log2 transformed TPM) (Table S1). (C) Correlation of the gene expression changes between iMGLs treated with brain phagocytic substrates from Dolan et al. and cytokine mix-treated macrophages (this study, adjusted p < 0.05) using Spearman method. p indicates two-tailed p value. (D) Quantification of surface expression of DLAM markers by flow cytometry. Values plotted as geometric fluorescent intensity. Groups were tested with paired t tests (two-tailed) *p < 0.05, **p < 0.01, ***p < 0.001. Percentage of positive cells plotted separately in Figure S2. Data are presented as mean ± SEM. Different dot shapes correspond with independent macrophage differentiations n = 3–4). ns, not significant.
Figure 3.
Figure 3.. Cytokine mix treatment induces DLAM, non-proliferative macrophage transcriptional states in THP-1 macrophages
(A) UMAPs of down-sampled scRNA-seq data comparing THP-1 macrophages at baseline (left) and after cytokine treatment (right). Clusters were identified using Seurat FindClusters. (B) Heatmap showing top expressed genes per cluster compared with all other clusters (log2FC > 0.6, q-value < 0.05, pct expressed > 70%). The left block shows the number of genes in each geneset and representative genes are labeled on the right. Z-scores across clusters are used for the plot. (C) The proportion of cells per treatment condition within each cluster after down-sampling. The percentage of cells from the total number of cells per cluster is shown on each bar. (D) Dotplot showing expression of selected DLAM marker genes across all clusters. The size of dots are scaled to represent the percentage of cells expressing the gene within the cluster. Average expression is normalized within each feature. (E) Expression of CLEC7A across clusters and split by treatment condition. Greater expression shown in red and low to no expression in gray.
Figure 4.
Figure 4.. Comparison of THP-1 macrophages treated with cytokine mix with iMGLs exposed to phagocytic substrates and AD brain signatures reveals induction of similar transcriptional states
(A) Hypergeometric overlap results showing enrichment of myeloid gene signatures in the up-regulated differentially expressed genes from pseudobulk scRNA-seq of cytokine treatment vs. controls, grouped by subtypes. (B) Sankey plot showing the projection of clusters found in this study to clusters identified by Dolan et al. by exposure of iMGLs to phagocytic substrates. (C) UMAP projections of THP-1 macrophages dataset, cells colored by module scores of transcriptional signatures identified in others studies.,, (D) Proliferation assay (measured by DNA-labeling, EdU kit) in THP-1 monocytes and THP-1 control and cytokine mix-treated macrophages. Data are presented as mean ± SD. Different dot shapes correspond to independent macrophage differentiations (n = 3).
Figure 5.
Figure 5.. Cytokine mix treatment decreases phagocytosis and lysosomal processing in THP-1 macrophages
(A) Diagram showing the steps in the efferocytosis process. (B) Evaluation of the migration capacity through the scratch wound assay in THP-1 macrophage control and treated with the cytokine mix. (B1) Relative wound density over time; (B2), quantification of the area under the curve. Cytochalasin D (cytD) was used as a migration inhibitor. (C) Quantification of phagocytic uptake of beads (C1), myelin fragments (C2), zymosan (C3), early apoptotic Jurkat cells (EAJ) (C4), and Aβ (3 and 24 h treatments) (C5) by flow cytometry. (D) Evaluation of lysosomal activity in control and cytokine stimulated macrophages by LysoTracker (lysosomal mass, D1), LysoSensor (acidification, D2), and DQ-BSA (lysosomal proteolysis, D3 and D4) by flow cytometry. Data are presented as mean ± SD. Different dot shapes correspond with independent macrophage differentiations n = 3–4. p indicates paired t test (two-tailed) *p < 0.05, **p < 0.01, ***p < 0.001, ns = non-statistically significant.
Figure 6.
Figure 6.. Cytokine mix treatment increases glycolytic and OXPHOS metabolism in THP-1 macrophages
(A) Seahorse mitostress test. (A1), Test profile of oxygen consumption over time. Quantification of basal (A2) and maximal (A3) respiration capacity. (B) Seahorse glycolysis stress test. (B1) Test profile of extracellular acidification rate over time. Quantification of basal glycolysis (B2) and maximal glycolytic capacity (B3). Data are presented as mean ± SD. Different dot shapes correspond to independent macrophage differentiations (n = 4). p represents paired t test (two-tailed) *p < 0.05, **p < 0.01.
Figure 7.
Figure 7.. Cytokine mix treatment induces changes in lipidomic profiles and lipid metabolism in THP-1 macrophages
(A) Lipidomics results from control and cytokine mix stimulated THP-1 macrophages. (B) Quantification of LD content (BODIPY) by flow cytometry in THP-1 control and stimulated macrophages. (C) Abundance of selected CE species (raw data in Table S4). (D) Quantification of intracellular APOE normalized to actin in THP-1 macrophages treated with cytokines. Quantification (left), representative images (right). (E) Quantification of secreted APOE in THP-1 macrophages. (F) Quantification of ABCA1, normalized to actin, measured by western blot in control and cytokine-treated THP-1 macrophages. Quantification (left), representative image (right). (G) Quantification of cholesterol efflux, in THP-1 control and stimulated macrophages into HDL acceptor. Data are presented as mean ± SD. Different dot shapes correspond with independent differentiations (n = 3–4). p represents paired t test (two-tailed) *p < 0.05, **p < 0.01.

Update of

References

    1. Bellenguez C, Küçükali F, Jansen IE, Kleineidam L, Moreno-Grau S, Amin N, Naj AC, Campos-Martin R, Grenier-Boley B, Andrade V, et al. (2022). New insights into the genetic etiology of Alzheimer’s disease and related dementias. Nat. Genet. 54, 412–436. - PMC - PubMed
    1. Huang K-L, Marcora E, Pimenova AA, Di Narzo AF, Kapoor M, Jin SC, Harari O, Bertelsen S, Fairfax BP, Czajkowski J, et al. (2017). A common haplotype lowers PU.1 expression in myeloid cells and delays onset of Alzheimer’s disease. Nat. Neurosci. 20, 1052–1061. - PMC - PubMed
    1. Nott A, Holtman IR, Coufal NG, Schlachetzki JCM, Yu M, Hu R, Han CZ, Pena M, Xiao J, Wu Y, et al. (2019). Brain cell type-specific enhancer-promoter interactome maps and disease risk association. Science 366, 1134–1139. 10.1126/science.aay0793. - DOI - PMC - PubMed
    1. Novikova G, Kapoor M, Tcw J, Abud EM, Efthymiou AG, Chen SX, Cheng H, Fullard JF, Bendl J, Liu Y, et al. (2021). Integration of Alzheimer’s disease genetics and myeloid genomics identifies disease risk regulatory elements and genes. Nat. Commun. 12, 1610. - PMC - PubMed
    1. Kosoy R, Fullard JF, Zeng B, Bendl J, Dong P, Rahman S, Kleopoulos SP, Shao Z, Girdhar K, Humphrey J, et al. (2022). Genetics of the human microglia regulome refines Alzheimer’s disease risk loci. Nat. Genet. 54, 1145–1154. - PMC - PubMed