

Supplement-driven iron overload accelerates phenotypic aging via inflammatory biomarkers: Potential counteraction through anti-inflammatory or antioxidant diets
- PMID: 40570516
- PMCID: PMC12246624
- DOI: 10.1016/j.redox.2025.103733
Supplement-driven iron overload accelerates phenotypic aging via inflammatory biomarkers: Potential counteraction through anti-inflammatory or antioxidant diets
Abstract
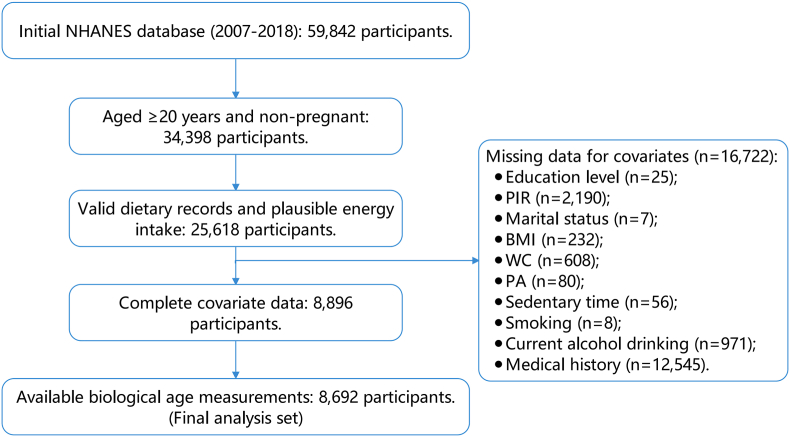
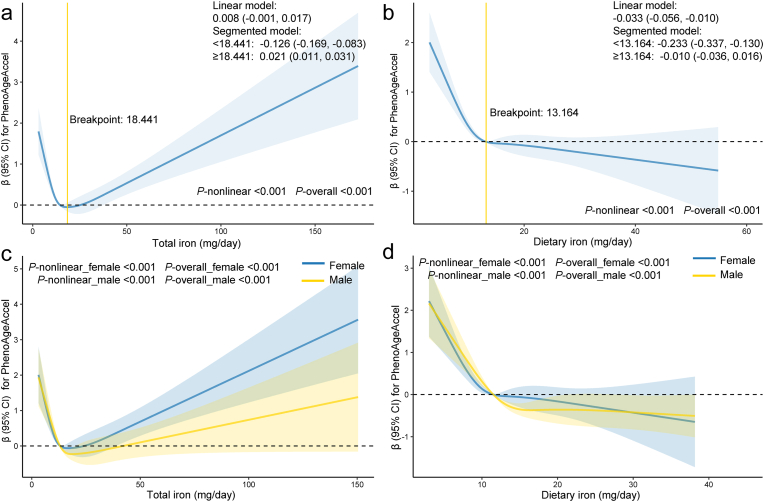
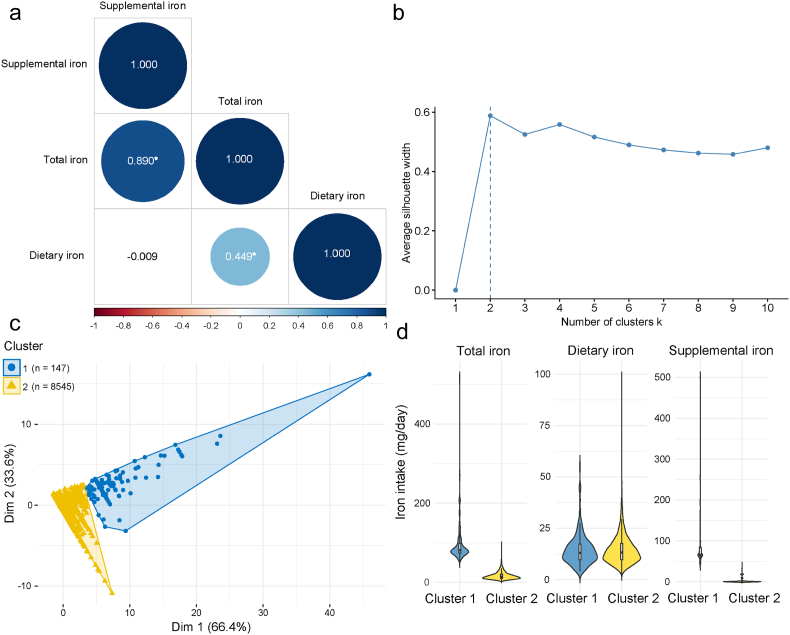
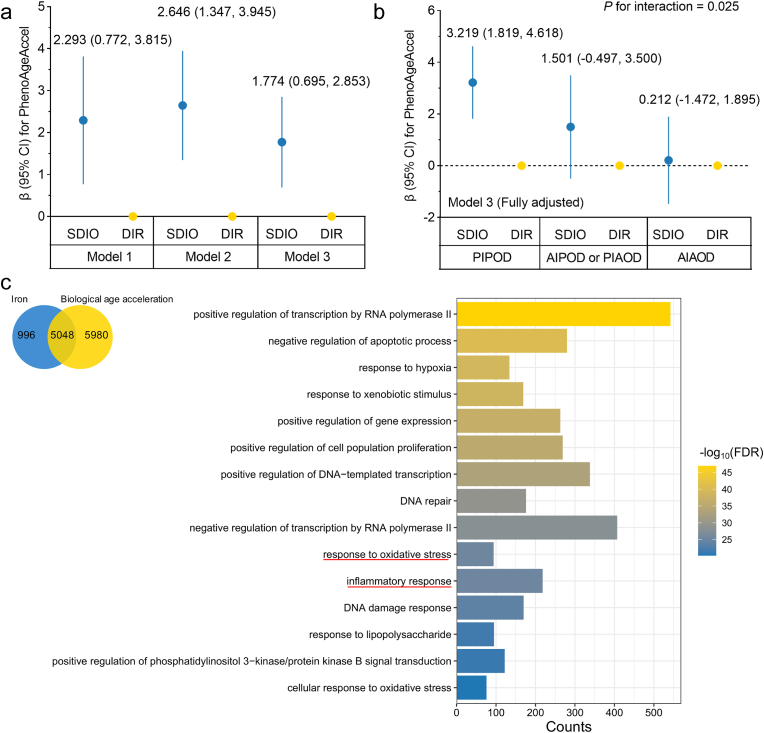
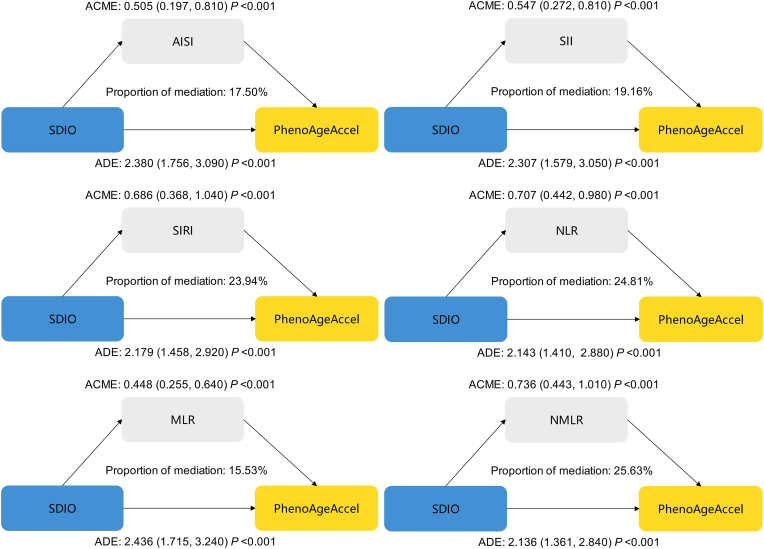
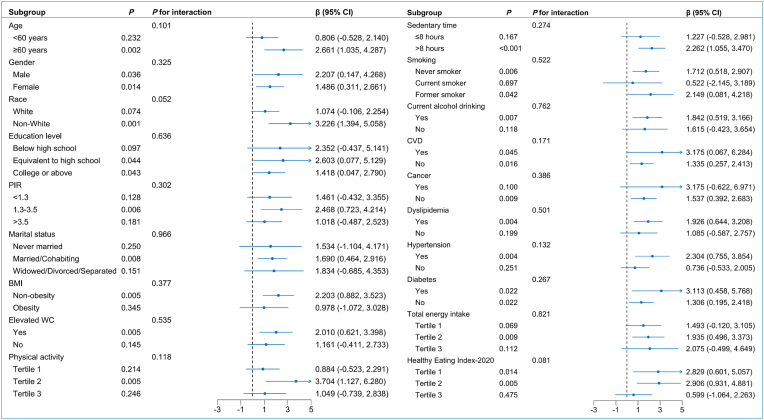
Given the dual effects of iron on health, we carried out this study to explore its relationship with phenotypic age (PhenoAge) and to evaluate the roles of inflammation and oxidative stress in this regard. Since these associations are still poorly understood, elucidating them is vital for understanding aging-related health outcomes. A cross-sectional study was conducted using NHANES 2017-2018 data, involving 8692 participants aged 20 years or older. The nonlinear relationships between iron intake and PhenoAge acceleration (PhenoAgeAccel) were assessed using weighted restricted cubic splines (RCS). Multivariable-adjusted analyses were performed using weighted generalized linear models (GLMs). K-means clustering was employed to identify patterns of iron co-exposure. Interaction effects were assessed using likelihood ratio tests, while mediation analyses were conducted to quantify the contributions of inflammation and oxidative stress markers. This study identified a U-shaped relationship between total iron intake and PhenoAgeAccel (breakpoint: 18.441 mg/day). Below this threshold, higher iron intake was protective against aging (β = -0.126); above it, aging accelerated (β = 0.021). Notably, dietary iron derived solely from food was not associated with any harmful effects on aging. In contrast, supplemental iron intake showed a positive association with PhenoAgeAccel (β = 0.017), highlighting the potential risks of excessive supplement use. Moreover, the aforementioned associations showed no gender differences. Cluster analysis split participants into two groups: dietary iron reference (DIR), mostly below the UL (45 mg/day) with minimal supplemental iron; and supplement-driven iron overload (SDIO), all exceeding the UL, with supplemental iron comprising 83.44 % of total intake on average. SDIO showed significantly faster phenotypic aging (β = 1.774) than DIR. However, anti-inflammatory or antioxidant diets were able to counteract this detrimental effect (P for interaction = 0.025). Inflammation-related markers partially mediated SDIO-associated aging acceleration (mediation proportion: 15.53 %-25.63 %). The results stayed robust even after adjusting for variables related to anemia and post-menstrual status. This study suggests that excessive use of supplements, resulting in iron overload, may accelerate individual aging through inflammation-related pathways. Nevertheless, a diet abundant in anti-inflammatory or antioxidant properties could counteract this heightened risk of aging.
Keywords: CDAI; DII; Diet; Inflammation; Iron; PhenoAgeAccel.
Copyright © 2025 The Authors. Published by Elsevier B.V. All rights reserved.
Conflict of interest statement
Declaration of competing interest The authors declare that they have no known competing financial interests or personal relationships that could have appeared to influence the work reported in this paper.
Figures
Similar articles
-
Differential associations of dietary inflammatory potential, antioxidant capacity, and Mediterranean diet adherence with biological aging: A UK Biobank study.J Nutr Health Aging. 2025 Jul 24;29(9):100638. doi: 10.1016/j.jnha.2025.100638. Online ahead of print. J Nutr Health Aging. 2025. PMID: 40712240 Free PMC article.
-
[Volume and health outcomes: evidence from systematic reviews and from evaluation of Italian hospital data].Epidemiol Prev. 2013 Mar-Jun;37(2-3 Suppl 2):1-100. Epidemiol Prev. 2013. PMID: 23851286 Italian.
-
Effectiveness and safety of vitamin D in relation to bone health.Evid Rep Technol Assess (Full Rep). 2007 Aug;(158):1-235. Evid Rep Technol Assess (Full Rep). 2007. PMID: 18088161 Free PMC article.
-
Systemic pharmacological treatments for chronic plaque psoriasis: a network meta-analysis.Cochrane Database Syst Rev. 2021 Apr 19;4(4):CD011535. doi: 10.1002/14651858.CD011535.pub4. Cochrane Database Syst Rev. 2021. Update in: Cochrane Database Syst Rev. 2022 May 23;5:CD011535. doi: 10.1002/14651858.CD011535.pub5. PMID: 33871055 Free PMC article. Updated.
-
Nutritional interventions for survivors of childhood cancer.Cochrane Database Syst Rev. 2016 Aug 22;2016(8):CD009678. doi: 10.1002/14651858.CD009678.pub2. Cochrane Database Syst Rev. 2016. PMID: 27545902 Free PMC article.
References
-
- López-Otín C., Blasco M.A., Partridge L., Serrano M., Kroemer G. Hallmarks of aging: an expanding universe. Cell. 2023;186:243–278. - PubMed
-
- Mukherjee M., Brouilette S., Stevens S., Shetty K.R., Samani N.J. Association of shorter telomeres with coronary artery disease in Indian subjects. Heart. 2008;95:669–673. - PubMed
LinkOut - more resources
Full Text Sources
