. 2025 Jun;122(6):e70305.
doi: 10.1111/tpj.70305.

Role of paternal Oryza sativa Baby Booms (OsBBMs) in initiating de novo gene expression and regulating early zygotic development in rice

Affiliations

Role of paternal Oryza sativa Baby Booms (OsBBMs) in initiating de novo gene expression and regulating early zygotic development in rice

Nargis Akter et al. Plant J. 2025 Jun.

Abstract

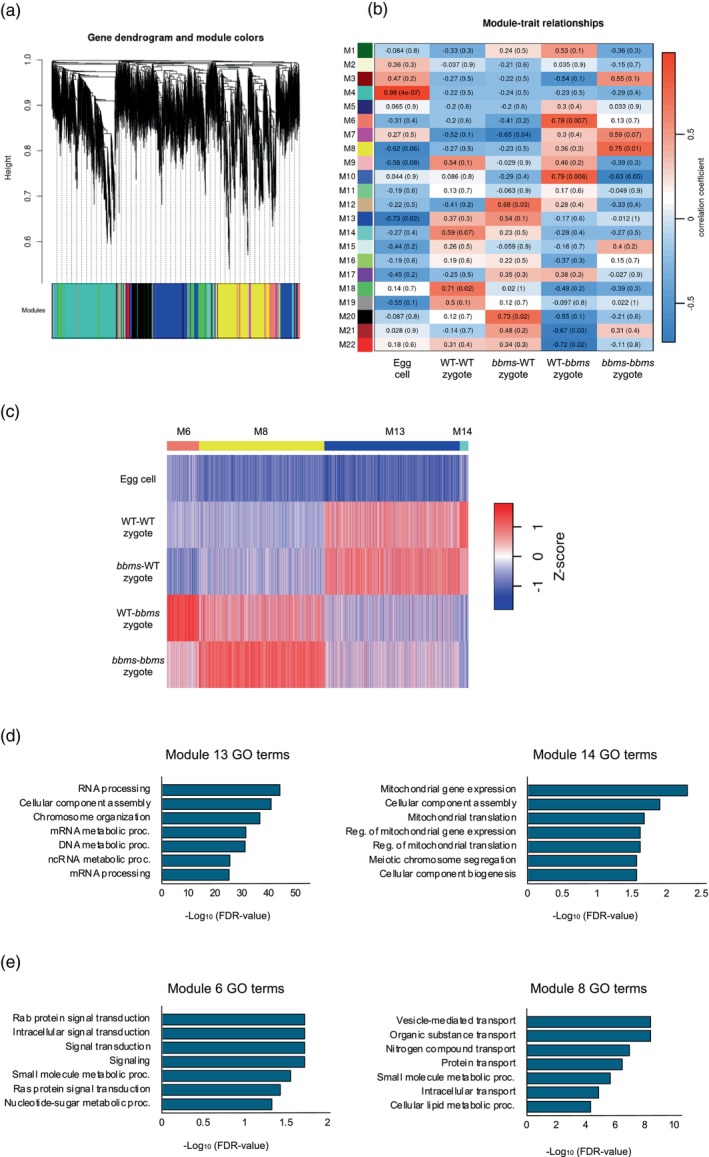
Oryza sativa BABY BOOM 1 (OsBBM1), a member of the AP2/ERF family of transcription factors, is expressed from paternal allele in rice zygote and plays a crucial role in initiating zygotic development. However, the mechanism how the paternal OsBBM1 drives this development remains unclear. Rice zygotes with four different gamete combinations with or without functional paternal OsBBMs were produced by electrofusion, using gametes isolated from bbms triple mutants and wild-type rice plants. Developmental and gene expression profiles of these types of zygotes were intensively analyzed and compared. Mutations in OsBBM1, OsBBM2, and OsBBM3 on the paternal alleles caused developmental arrest or delay in the zygotes, while defects in OsBBMs on the maternal allele had minimal effects on zygotic development. Paternal allele of OsBBMs significantly influenced gene expression profiles related to regulation of basic cellular processes, such as chromosome/chromatin organization/assembly and cell cycle/division compared to the maternal allele of OsBBMs. Majority of these genes were upregulated in zygotes from paternal/parental alleles via paternal OsBBMs. Paternal OsBBMs initiate early development of rice zygotes through the regulation of expression profiles of genes controlling status of chromosome/chromatin and cell cycle/division.

Keywords: AP2 transcription factor; Oryza sativa; OsBBMs; development; fertilization; paternal allele; transcriptome analysis; zygote.


Conflict of interest statement

The authors have not declared a conflict of interest.

Figures

Figure 1
Figure 1
Effects of OsBBMs derived from paternal or maternal alleles on the developmental profiles of rice zygotes. (a) A WT‐WT zygote was produced by the fusion of gametes isolated from wild‐type (WT) rice plants (top panel), and the developmental profile of the resulting zygote was observed (bottom panel). A WT‐WT zygote developed into a two‐celled embryo at 1 day after fusion (Panel I), a multicellular structure at 3 days after fusion (Panel II), a globular‐like embryo at 6 days after fusion (Panel III), and a cell mass at 9–15 days after fusion (Panels IV–VI). The cell mass subsequently developed into a white callus (Panel VII), and regenerated into a plantlet (Panel VIII). The proportion 20/23 in parentheses represents the ratio between the number of developed zygotes that regenerated into a plantlet and the number of zygotes produced. (b) A bbms‐bbms zygote was produced by the fusion of gametes isolated from bbms triple mutant plants (top panel), and the developmental profiles of the resulting zygote were observed (middle and bottom panels). A bbms‐bbms zygote degenerated without division (Panels I–II). Alternatively, a bbms‐bbms zygote remained in the one‐celled stage until 3 days after fusion (Panels III–IV) and developed into a possible two‐celled embryo at 6 and 9 days after fusion (Panels V–VI), a multicellular structure at 13 days after fusion (Panel VII), and a globular‐like embryo at 15 days after fusion (Panel VIII). Thereafter, the globular embryo exhibited developmental arrest and degenerated. The proportion 10/22 in parentheses at middle panel represents the ratio between the number of degenerated zygotes and the number of zygotes produced. The proportion 10/22 in parentheses at bottom panel represents the ratio between the number of developed zygotes/embryos and the number of zygotes produced. (c) A WT‐bbms zygote was produced by the fusion of a WT egg cell and bbms sperm cell (first panel), and the developmental profiles of the resulting zygote were observed (second, third, and fourth panels). A WT‐bbms zygote degenerated without division (Panels I–II). Alternatively, a WT‐bbms zygote was detected in the one‐celled stage at 1 day after fusion (Panel III), developed into a possible two‐celled embryo at 2 days after fusion (Panel IV), and a globular‐like embryo at 7–12 days after fusion (Panels V–VII). The globular‐like embryo exhibited developmental arrest and subsequently degenerated. Another WT‐bbms zygote was detected in the one‐celled stage at 1 day after fusion (Panel VIII), developed into a possible two‐celled embryo at 3 days after fusion (Panel IX), a multicellular structure at 6 days after fusion (Panel X), and a cell mass at 10–14 days after fusion (Panels XI–XII). The cell mass developed into a white callus (Panel XIII) and regenerated into a plantlet (Panel XIV). The proportion 8/23 in parentheses at second panel represents the ratio between the number of degenerated zygotes and the number of zygotes produced. The proportion 14/23 in parentheses at third panel represents the ratio between the number of developed zygotes/embryos and the number of zygotes produced. The proportion 7/23 in parentheses at fourth panel represents the ratio between the number of developed zygotes that regenerated into a plantlet and the number of zygotes produced. (d) A bbms‐WT zygote was produced by the fusion of a bbms egg cell and WT sperm cell (top panel), and the developmental profile of the resulting zygote was observed (bottom panel). A bbms‐WT zygote developed into a possible two‐celled embryo at 1 days after fusion (Panel I), a globular‐like embryo at 2 days after fusion (Panel II), and a cell mass at 7–15 days after fusion (Panels III–VI). The cell mass developed into a white callus (Panel VII) and regenerated into a plantlet (Panel VIII). The proportion 6/20 in parentheses represents the ratio between the number of developed zygotes that regenerated into a plantlet and the number of zygotes produced. Color‐coding for gamete and zygote genotypes: (a) orange, light blue, and pink circles indicate the nuclei/chromatins in the WT egg cell, WT sperm cell, and WT‐WT zygote, respectively. (b) Yellow, green, and bronze circles indicate the nuclei/chromatins in the bbms egg cell, bbms sperm cell, and bbmsbbms zygote, respectively. (c, d) Purple and olive circles indicate the nuclei/chromatins in the WT‐bbms and bbms‐WT zygote, respectively. Scale bars: 20 μm (a, Panels I–III; b, Panels I–VIII; c, Panels I–IV; c, Panels VIII–X; d, Panels I–II); 50 μm (a, Panel IV; b, Panels V–VII; c, Panels XI–XII; d, Panel III); 100 μm (a, Panels V–VI; d, Panels IV–VI); 0.5 cm (a, Panels VII–VIII; c, Panels XIII–XIV; d, Panels VII–VIII).
Figure 2
Figure 2
Effects of OsBBMs derived from paternal or maternal alleles on the division profiles of rice zygotes. (a–c) Development of zygotes produced by the fusion of an egg cell from wild‐type (WT) rice plants with a sperm cell from WT rice plants expressing H2B‐GFP (a, WT‐GFP zygote), the fusion of an egg cell from WT rice plants expressing H2B‐GFP with a sperm cell from bbms triple mutant rice plants (b, GFP‐bbms zygote), and the fusion of an egg cell from bbms triple mutant rice plants with a sperm cell from WT rice plants expressing H2B‐GFP (c, bbms‐GFP zygote). The produced zygotes were cultured, and their developmental and division profiles were observed at 18, 42, and 66 h after gamete fusion. The top, middle, and bottom panels are fluorescence, merged, and bright‐field images, respectively. (d) Average nuclear numbers in early embryos from WT‐GFP zygotes, GFP‐bbms zygotes, and bbms‐GFP zygotes at 18, 42, and 66 h after gamete fusion. Asterisks indicate significant differences based on analysis of variance (anova), Tukey's honest test (P < 0.05); ns = non‐significant (P > 0.05); Scale bars: 20 μm.
Figure 3
Figure 3
Gene expression profiles in zygotes with or without paternal OsBBMs. (a) Principal component analysis of zygotes/embryos at different developmental stages at 4, 18, 42, and 66 h after fusion. (b) The number of differentially expressed genes (DEGs) in bbms‐WT, WT‐bbms, and bbms‐bbms zygotes compared to WT‐WT zygotes at 4 h after fusion.
Figure 4
Figure 4
Correlation between the gene modules and gamete combination of zygotes with the presence or absence of paternal OsBBMs. (a) Weighted gene co‐expression network analysis (WGCNA) cluster dendrogram showing co‐expression modules. Modules are assigned with distinct colors. (b) Module–trait correlation between the gene modules and gamete combination of zygotes at 4 h after fusion with the presence or absence of paternal OsBBMs. The correlation is estimated using the Pearson correlation coefficient method. (c) Heatmap showing expression patterns of four stage‐specific modules across all tested stages. (d, e) Gene Ontology (GO) analysis of the genes that were highly correlated with the presence or absence of paternal OsBBMs in rice zygotes.
Figure 5
Figure 5
Correlation between the gene modules and gamete combination of zygotes/embryos with the presence or absence of paternal OsBBMs. (a) Weighted gene co‐expression network analysis (WGCNA) cluster dendrogram showing co‐expression modules. Modules are assigned with distinct colors. (b) Module–trait correlation between the gene modules and gamete combination of zygotes/embryos at 18 h after fusion with the presence or absence of paternal OsBBMs. The correlation is estimated using the Pearson correlation coefficient method. (c) Heatmap showing expression patterns of four stage‐specific modules across all tested stages. (d) Gene Ontology (GO) analysis of the genes that were highly correlated with the presence or absence of paternal OsBBMs in rice zygotes.
Figure 6
Figure 6
Allele dependency of genes expressed in intersubspecific zygotes (a, b) and genes possibly regulated via paternal OsBBMs (c, d). (a) Venn diagram of the 445 genes for which allele dependency was accurately determined in rice zygotes at 4 h after fusion. Twenty, 86, and 339 genes were categorized as paternal monoallelic, maternal monoallelic, and biallelic expressed genes, respectively. (b) Venn diagram of the 5295 genes for which allele dependency was accurately determined in rice zygotes at 18 h after fusion. Nine and three genes were categorized as paternal and maternal preferentially expressed genes, respectively. Five thousand two hundred eighty‐three genes were categorized as biallelic expression. (c) Monoallelic and biallelic genes in (a) were separated into Modules 6, 8, 13, and 14, which were created using the weighted gene co‐expression network analysis (WGCNA) approach in Figure 4. (d) Gene Ontology (GO) analysis of the 89 biallelic genes in Module 13 from panel (c).
Figure 7
Figure 7
Schematic illustration of developmental progression in rice zygotes via OsBBMs derived from the paternal allele. In rice zygotes arising from the union of gametes, the zygotic nucleus is formed through karyogamy, during or after which de novo gene expression is initiated from the zygotic genome, leading to precise and active zygotic development (Ohnishi et al., 2014). Subsequently, the zygote divides into a two‐celled embryo through the reorganization of cellular polarity, and the two‐celled embryo further develops into a globular‐like embryo structure and cell mass (Uchiumi et al., ; Sato et al., 2010). The presence of the paternal allele of OsBBMs allows for the proper early development of zygotes and embryos due to the appropriate expression of genes related to cellular machinery, such as chromosome organization, chromatin assembly, cell cycle, and cell division. However, in zygotes harboring bbms mutations in the paternal allele, these genes are negatively regulated, suppressed, or misexpressed, resulting in developmental delays or defects.

Similar articles

References

    1. Abiko, M. , Maeda, H. , Tamura, K. , Hara‐Nishimura, I. & Okamoto, T. (2013) Gene expression profiles in rice gametes and zygotes: identification of gamete‐enriched genes and up‐ or down‐regulated genes in zygotes after fertilization. Journal of Experimental Botany, 64, 1927–1940. - PMC - PubMed
    1. Boycheva, I. , Vassileva, V. , Revalska, M. , Zehirov, G. & Iantcheva, A. (2015) Cyclin‐like F‐box protein plays a role in growth and development of the three model species Medicago truncatula, Lotus japonicus, and Arabidopsis thaliana . Research and Reports in Biology, 6, 117–130.
    1. Castel, S.E. , Levy‐Moonshine, A. , Mohammadi, P. , Banks, E. & Lappalainen, T. (2015) Tools and best practices for data processing in allelic expression analysis. Genome Biology, 16, 195. - PMC - PubMed
    1. Chen, S. , Zhou, Y. , Chen, Y. & Gu, J. (2018) Fastp: an ultra‐fast all‐in‐one FASTQ preprocessor. Bioinformatics, 34, i884–i890. - PMC - PubMed
    1. Cingolani, P. , Platts, A. , Wang, lL. , Coon, M. , Nguyen, T. , Wang, L. et al. (2012) A program for annotating and predicting the effects of single nucleotide polymorphisms, SnpEff: SNPs in the genome of Drosophila melanogaster strain w1118; iso‐2; iso‐3. Fly, 6, 80–92. - PMC - PubMed