. 2025 Jul 21;5(7):101087.
doi: 10.1016/j.crmeth.2025.101087. Epub 2025 Jun 25.

TAS-seq enables subcellular single-stranded adenosine profiling by signal peptide-assisted adenosine deamination

Affiliations

TAS-seq enables subcellular single-stranded adenosine profiling by signal peptide-assisted adenosine deamination

Lixia Wang et al. Cell Rep Methods. .

Abstract

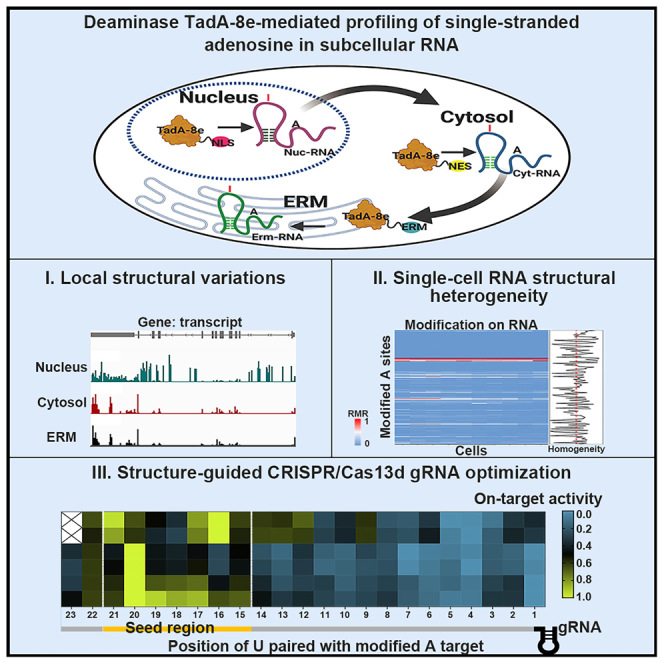
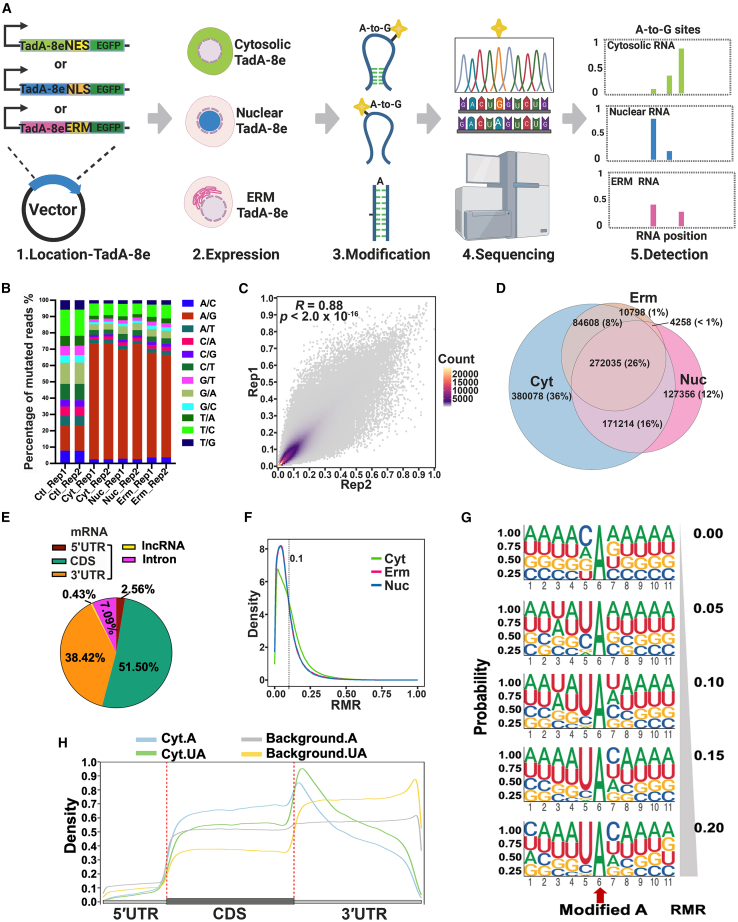
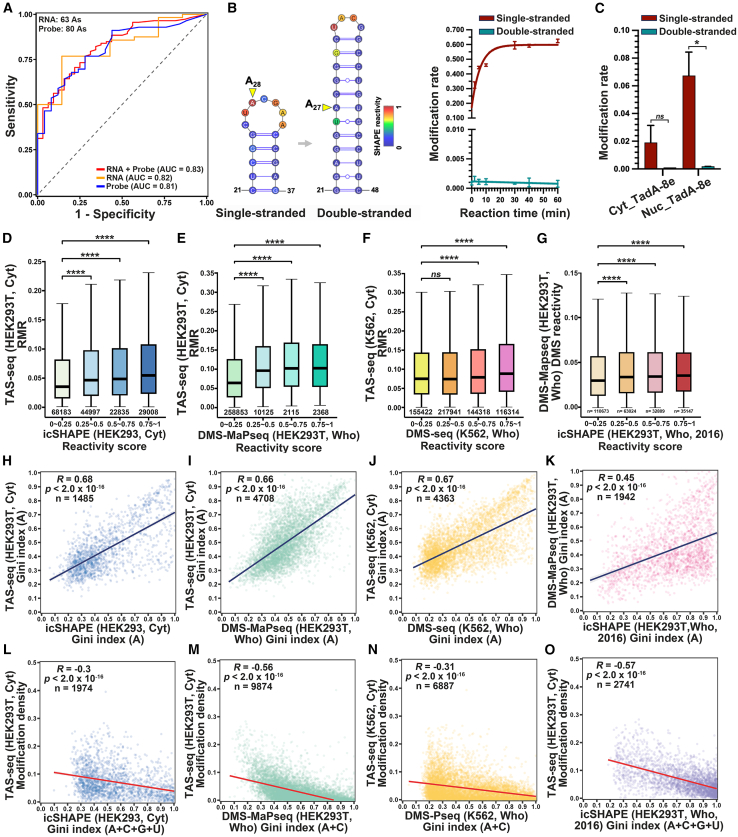
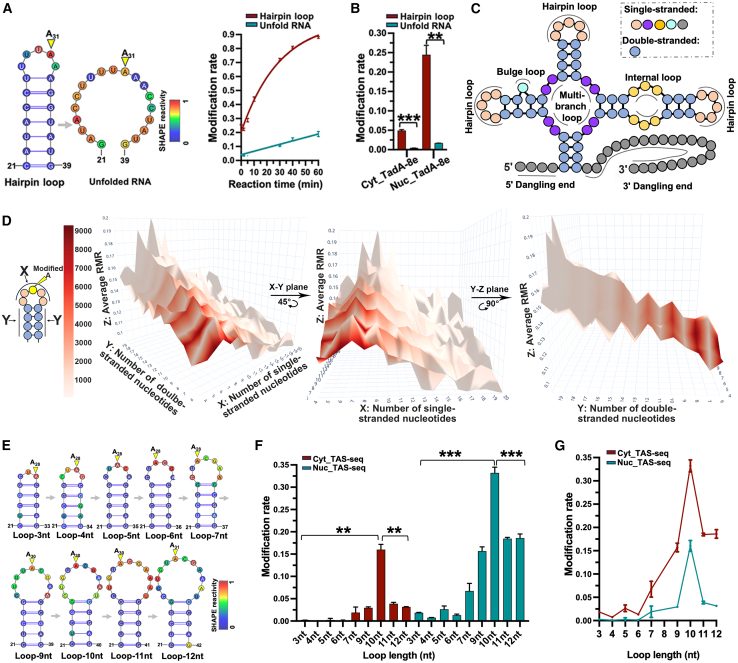
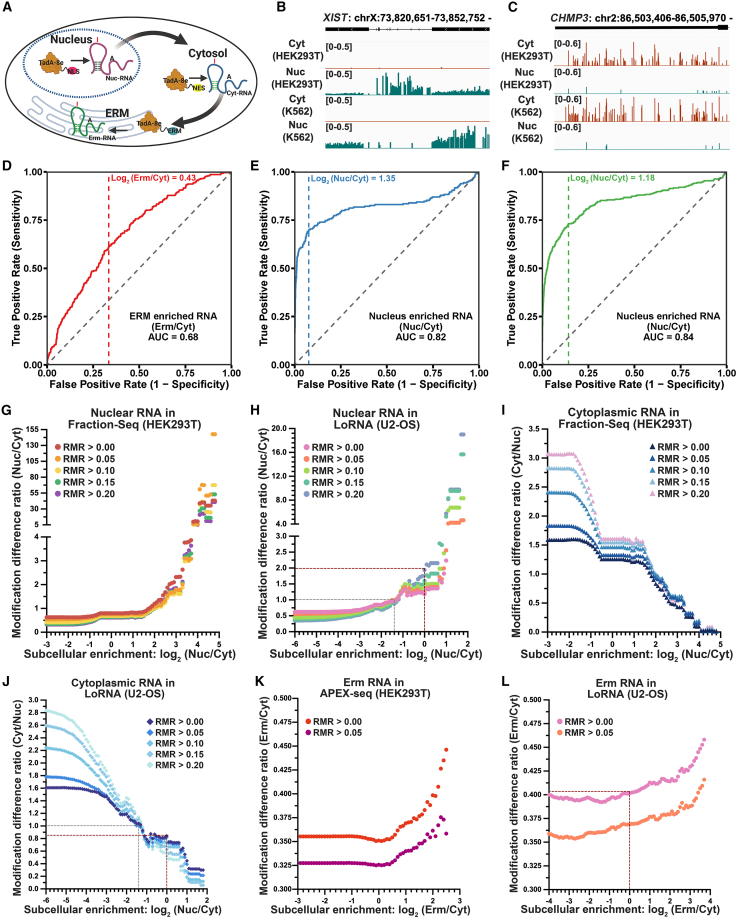
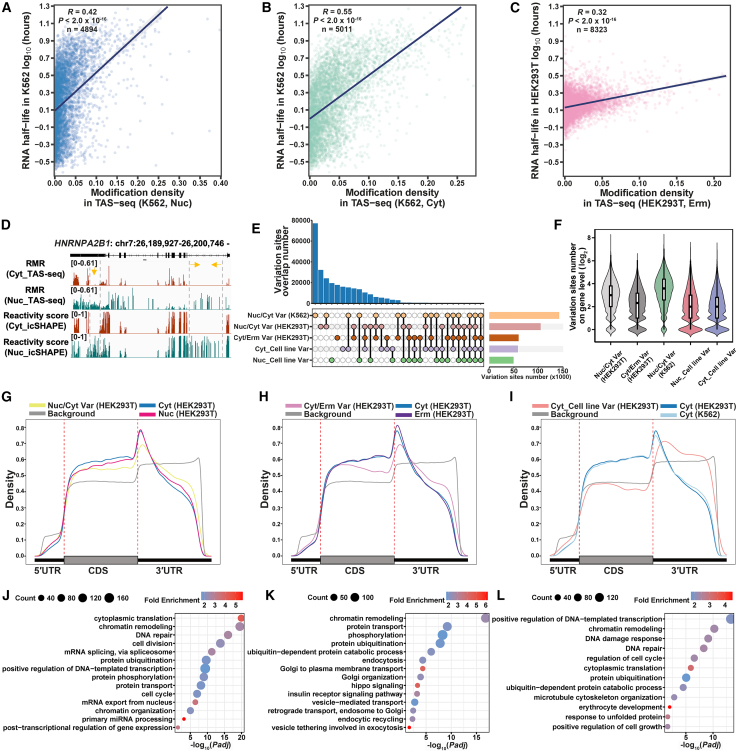
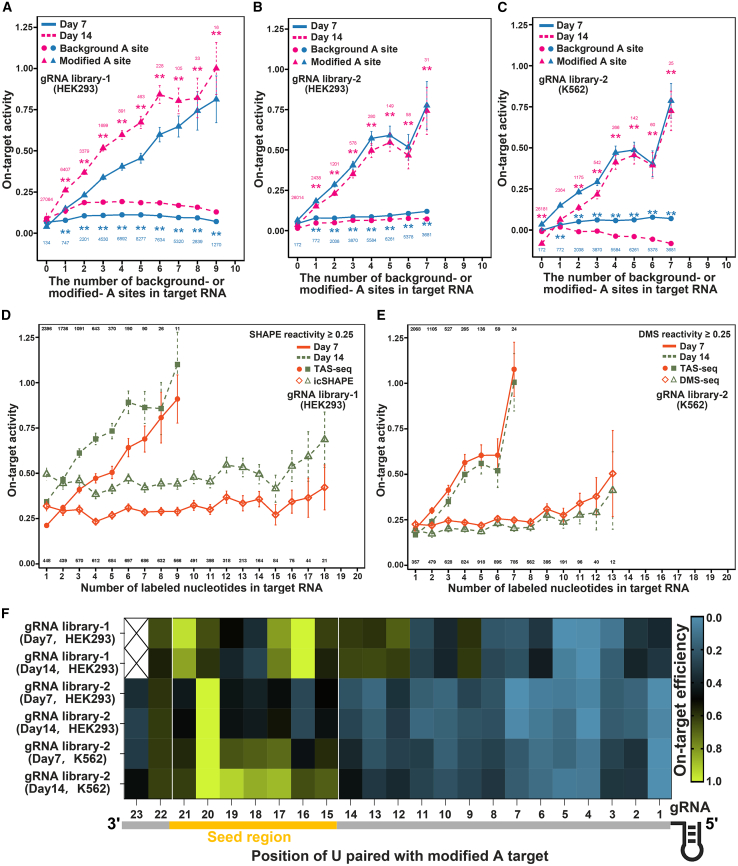
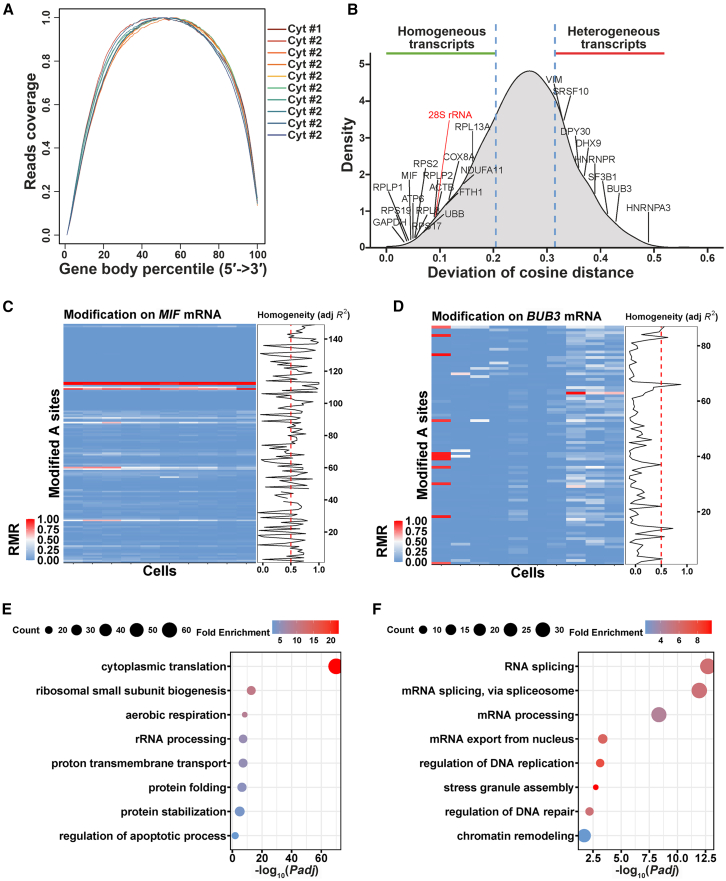
RNA structure plays a crucial role in its function and undergoes dynamic changes throughout its life cycle. To study these dynamics, we developed TAS sequencing (TAS-seq), which expresses the deaminase TadA-8e in specific subcellular compartments to modify single-stranded adenosines, particularly within hairpin loops. We applied TAS-seq to the nucleus, cytosol, and endoplasmic reticulum membrane, identifying adenosine structural variations and compartment-specific regulation of RNA stability. Single-cell TAS-seq revealed structural heterogeneity of cytosolic RNAs. Additionally, adenosines labeled by TAS-seq contribute to guide RNA optimization in the CRISPR-Cas13d system. Our method provides insights into compartment-specific RNA structural dynamics, cell-specific heterogeneity, and their functional implications.

Keywords: CP: cell biology; CP: molecular biology; RNA structural dynamics; gRNA structure and performance; subcellular adenosine structure profiling.


Conflict of interest statement

Declaration of interests The authors declare no competing interests.

Figures

None
Graphical abstract
Figure 1
Figure 1
TAS-seq development and performance in HEK293T cells (A) TAS-seq workflow for subcellular RNA detection. (B) Mutation types in sequenced reads. The y axis represents the proportion of each mutation type relative to the total mutations, while the x axis indicates the sample source. (C) Pearson correlation of mutation rates between two biological replicates. (D) Modification sites across three compartments. (E) Distribution of modification sites across RNA species and functional regions. (F) Frequency distribution of RMR values. (G) Sequence logos centered on modified adenine (A) residues, with RMR bins (0.00–1.00). (H) Distribution of modified A sites and background A sites along mRNA, in the "UA" context or not. Data in (C), (E), (H), and (G) were obtained from Cyt_TAS-seq.
Figure 2
Figure 2
TAS-seq structure preference of for single-stranded RNA (A) ROC curve showing TAS-seq’s accuracy in detecting well-characterized RNAs and RNA probes. (B) In vitro modification of ss-A or ds-A by recombinant TadA-8e. Left: Secondary structure of the RNA probe, color-coded by SHAPE reactivity scores, with the target A marked by a yellow triangle. Right: Modification rates (mean ± SD) over time. The ss-A follows a single exponential model (rate: 0.168 ± 0.002 min−1), while ds-A shows a slower, non-exponential modification rate. (C) Modification of RNAs in (B) by cytosol TadA-8e expressed in HEK293T cells. Data are presented as mean ± SD. n = 3. (D–F) Boxplots showing RMRs of A sites in Cyt_TAS-seq from HEK293T cells, overlapping with icSHAPE in HEK293 cytoplasm (D), DMS-MaPseq in whole HEK293T cells (E), and DMS-seq in whole K562 cells (F). (G) Boxplot comparing DMS reactivities of A sites in DMS-MaPseq with those in icSHAPE from whole HEK293T cells. (H–K) Pearson correlations between Gini indices from distinct methods, as indicated. (L–O) Pearson correlations between modification density (number of modification sites per gene length) in TAS-seq and RNA folding, represented by the Gini indices calculated by four nucleotides for SHAPE-based methods and A/C for DMS-based methods. For (C)–(G), p values were calculated using the two-sided Mann-Whitney U test. ∗p < 0.05; ∗∗p < 0.01; ∗∗∗p < 0.001; ∗∗∗∗p < 0.0001. Boxplots show the median and 25th–75th percentile range, with the bars indicating the 5th–95th percentile range. For (D)–(G), reactivity scores were divided into four ranges: 0–0.25, 0.25–0.5, 0.5–0.75, and 0.75–1. The numbers of A sites (D–G) and genes (H–O) used in analyses are labeled.
Figure 3
Figure 3
TAS-seq preference for hairpin loop substructure (A) In vitro modification of ss-A in a hairpin loop or the unfolded RNA by recombinant TadA-8e. Left: Secondary structure of the RNA probe, color-coded by SHAPE reactivity scores, with target A marked by a yellow triangle. Right: Modification rates (mean ± SD) of ss-A in hairpin loop RNA and unfolded RNA fitted a single exponential model, with speeds of 0.034 ± 0.0004 min−1 and 0.0006 ± 0.00002 min−1, respectively. (B) Modification of RNAs from (A) by TadA-8e expressed in HEK293T cells. (C) Diagram of substructures based on the nearest-neighbor model. (D) 3D map displaying the features of the hairpin structures containing modified ss-As. The model on the left indicates the values of the x axis and y axis. The map shows the loop length (x axis), helix length (y axis), the averaged RMR of modification sites (z axis), and the number of modification sites (color). The jagged pattern in the y-z plane was due to odd y values resulting from the bulge loop. Removing these values smoothed the y-z plane (Figure S4K). (E) Secondary structure of RNA probes ranked by increasing loop length. (F) Boxplot showing RMR of target A from (E). (G) The line plot shows changes in RMRs as loop length increases based on data from (F). For (B), (F), and (G), data are presented as mean ± SD. n = 3. For (B) and (F), p values were calculated using the two-sided Mann-Whitney U test. ∗p < 0.05; ∗∗p < 0.01; ∗∗∗p < 0.001; ∗∗∗∗p < 0.0001.
Figure 4
Figure 4
TAS-seq can detect subcellular RNA (A) Schematic of TadA-8e localization and subcellular RNA labeling. (B and C) IGV tracks displaying RMR profiles for XIST lncRNA (B) and CHMP3 mRNA (C). (D–F) ROC analysis of TAS-seq specificity for HEK293T ERM (D), HEK293T nucleus (E), and K562 nucleus (F)-enriched RNAs. Colored dashed lines and text show ROC cutoffs. (G–L) Correlation plots between TAS-seq modification differences (y axis) and RNA enrichment ratios (x axis) from Fractionation-seq (G and I), LoRNA (H, J, and L), and APEX-seq (K) methods, as indicated.
Figure 5
Figure 5
RNA structure dynamics (A–C) Scatterplots showing the Pearson correlation between RNA half-life and modification density (number of modification sites per gene length) in the nucleus (A) and cytosol (B) of K562 cells, and ERM of HEK293T cells (C). The "n" represents the number of genes used in analyses. (D) IGV tracks showing the dynamic structure of HNRNPA2B1 mRNA. (E) Variation sites across five comparison groups, along with the overlap of variation sites between each pair of groups. (F) The number of variation sites at the gene level. (G–I) Distribution of variation sites across mRNA. (J–L) Enriched GO terms for the top 30% of genes with the highest number of variation sites. For (G)–(L), variation sites were from a comparison between the nucleus and cytosol of HEK293T cells (G and J), the cytosol and ERM of HEK293T cells (H and K), and the cytosol of HEK293T cells and K562 cells (I and L).
Figure 6
Figure 6
TAS-seq contributes to gRNA selection for the CRISPR-Cas13d system in vivo (A–C) gRNA on-target activity correlates with nuclear modifications in HEK293T (A and B: libraries 1–2) and K562 (C: library 2). (D and E) Comparison of TAS-seq with icSHAPE (E) and DMS-seq (E) for gRNA selection (SHAPE/DMS reactivity threshold ≥0.25). (F) Heatmap showing the averaged on-target activity (min-max normalized) of gRNAs targeting modified A sites in each position. For (A)–(E), on-target activity was quantified by gRNA counts at day 7 of 14 (mean ± SE). Two-sided Mann-Whitney U test; ∗∗p < 0.01. Analyzed gRNA numbers (n ≥ 10) are shown near trendlines.
Figure 7
Figure 7
STAS-seq reveals single-cell RNA structural heterogeneity (A) Gene body coverage of Cyt_scTAS-seq. (B) Transcript-level structural heterogeneity across cells (homogeneous: 25th percentile; heterogeneous: 75th percentile) with representative gene annotations. (C and D) Heatmap of RMR and homogeneity R2 to represent the structural homogeneity of MIF mRNA (C) and the structural heterogeneity of BUB3 mRNA (D) (Rows: modifications; Columns: single cells; Line plots: site-specific R2 values). (E and F) Enriched GO terms for structurally homogeneous (E) and heterogeneous (F) transcripts.

Similar articles

References

    1. Skourti-Stathaki K., Proudfoot N.J., Gromak N. Human senataxin resolves RNA/DNA hybrids formed at transcriptional pause sites to promote Xrn2-dependent termination. Mol. Cell. 2011;42:794–805. doi: 10.1016/j.molcel.2011.04.026. - DOI - PMC - PubMed
    1. Bevilacqua P.C., Ritchey L.E., Su Z., Assmann S.M. Genome-Wide Analysis of RNA Secondary Structure. Annu. Rev. Genet. 2016;50:235–266. doi: 10.1146/annurev-genet-120215-035034. - DOI - PubMed
    1. Warf M.B., Berglund J.A. Role of RNA structure in regulating pre-mRNA splicing. Trends Biochem. Sci. 2010;35:169–178. doi: 10.1016/j.tibs.2009.10.004. - DOI - PMC - PubMed
    1. Leppek K., Das R., Barna M. Functional 5' UTR mRNA structures in eukaryotic translation regulation and how to find them. Nat. Rev. Mol. Cell Biol. 2018;19:158–174. doi: 10.1038/nrm.2017.103. - DOI - PMC - PubMed
    1. Ishiguro A., Kimura N., Watanabe Y., Watanabe S., Ishihama A. TDP-43 binds and transports G-quadruplex-containing mRNAs into neurites for local translation. Genes Cells. 2016;21:466–481. doi: 10.1111/gtc.12352. - DOI - PubMed

LinkOut - more resources