. 2025 Jun 24;301(8):110414.
doi: 10.1016/j.jbc.2025.110414. Online ahead of print.

Microcurrent stimulation induces cell death in p53-mutant and 5-FU-resistant breast cancer

Affiliations

Microcurrent stimulation induces cell death in p53-mutant and 5-FU-resistant breast cancer

Tomohito Tanihara et al. J Biol Chem. .

Abstract

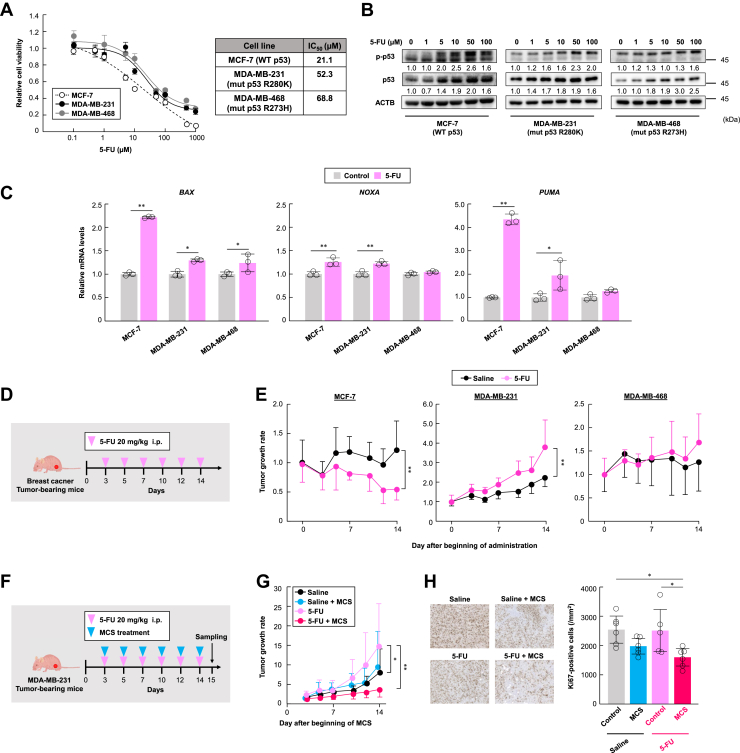
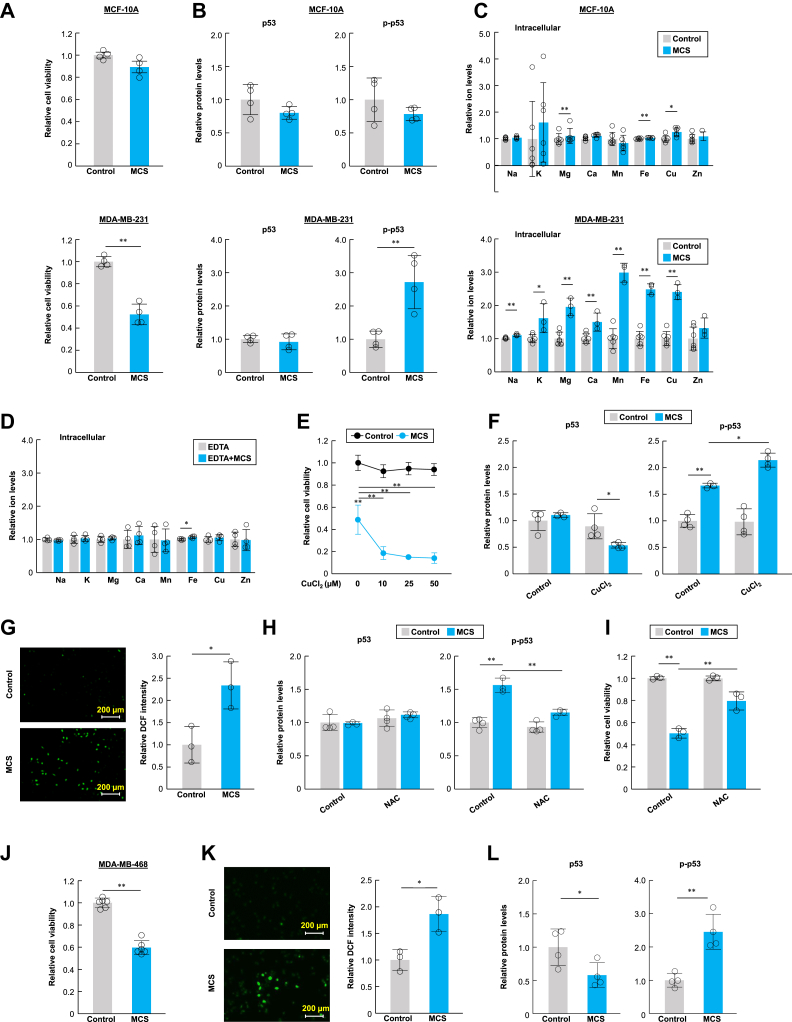
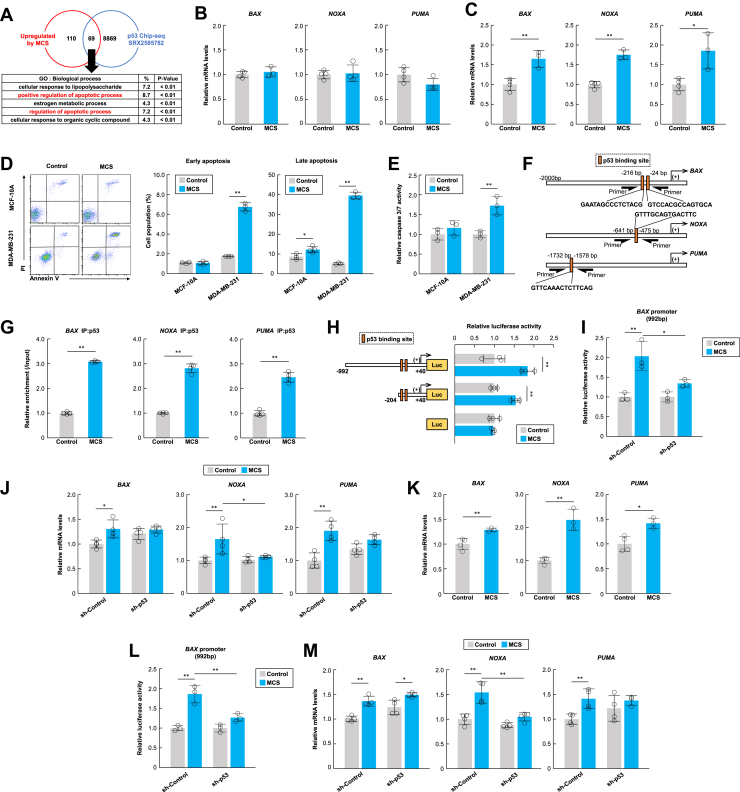
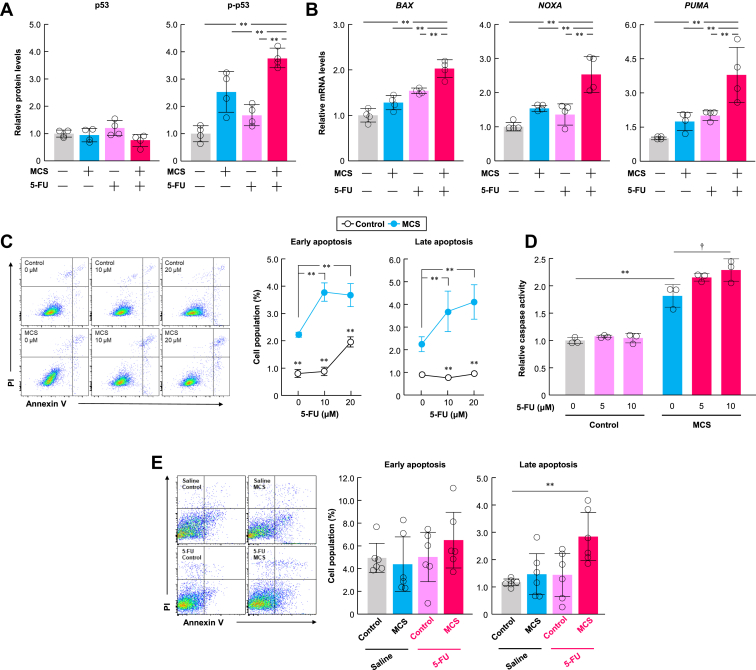
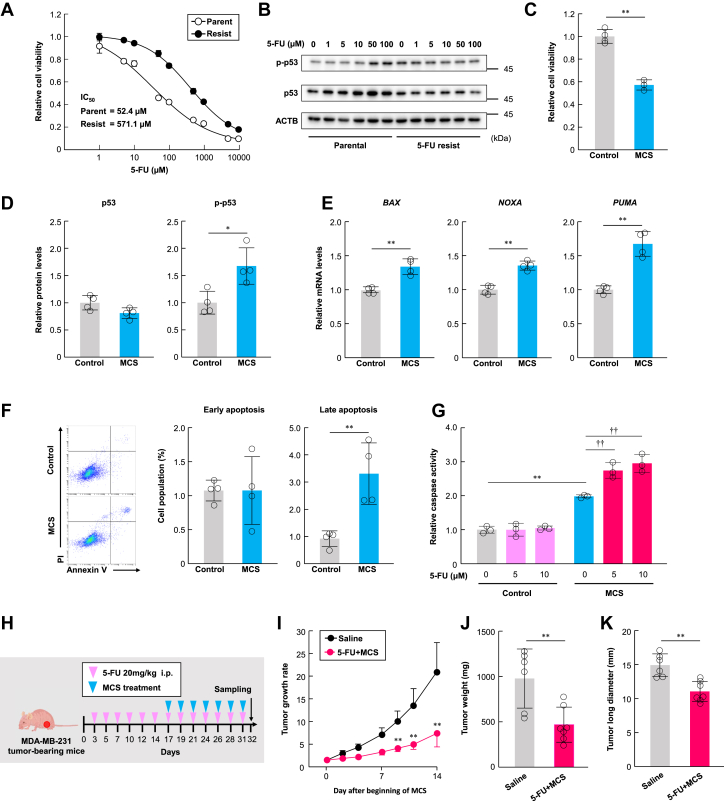
5-Fluorouracil (5-FU) is a commonly used chemotherapeutic agent for breast cancer. Its efficacy relies on the function of p53, and mutations in p53 contribute to the development of resistance during 5-FU chemotherapy. Here, we report that microcurrent stimulation (MCS) of a p53-mutant breast cancer cell line induces p53-mediated cell death. Although MDA-MB-231 and MDA-MB-468 cells, both human breast cancer cell lines, are less sensitive to 5-FU due to p53 mutations, MCS (300 μA for 30 min) induced apoptosis in these cells and improved the antitumor effect of 5-FU in tumor-bearing mice. MCS-induced apoptosis was mediated by an increase in intracellular Cu2+ ions and reactive oxygen species, along with the concurrent transcriptional enhancement of pro-apoptotic genes by p53. Furthermore, MCS induced apoptosis in MDA-MB-231 cells that had developed resistance to 5-FU and inhibited tumor growth in tumor-bearing mice with reduced 5-FU sensitivity. These findings suggest that an approach involving MCS could serve as a foundation for developing breast cancer treatment strategies to overcome p53 mutations.

Keywords: 5-fluorouracil; MDA-MB-231 cells; apoptosis; breast cancer; cell death; chemoresistance; flow cytometry; microcurrent; p53; reactive oxygen species (ROS).


Conflict of interest statement

Conflict of interest The authors declare that they have no conflicts of interest with the contents of this article.

Figures

Figure 1
Figure 1
MCS improves resistance to 5-FU in cells and enhances antitumor effects in MDA-MB-231 cells.A, cell viability of MCF-7, MDA-MB-231, and MDA-MB-468 cells exposed to 5-FU. Cells were treated with 5-FU at concentrations ranging from 0 to 1000 μM for 72 h. The right panel shows the IC50 values for each cell line, with the 5-FU untreated group set at 1.0. Values are presented as the mean ± S.D. (n = 4). B, protein levels of p53 and phosphorylated p53 (p-p53) after treatment with 5-FU at concentrations ranging from 0 to 100 μM for 48 h in MCF-7, MDA-MB-231, and MDA-MB-468 cells. The value of the 5-FU untreated group is set at 1.0. The uncropped image of p53 and p-p53 proteins in the cells is illustrated in Figure S13A. C, mRNA levels of p53 target pro-apoptotic genes BAX, NOXA, and PUMA after treatment with 5-FU at a concentration of 10 μM for 48 h in MCF-7, MDA-MB-231, and MDA-MB-468 cells. The value of the 5-FU untreated group is set at 1.0. Values are presented as the mean ± S.D. (n = 3). ∗p < 0.05, ∗∗p < 0.01 (ANOVA with a Tukey–Kramer post hoc test). D, schematic experimental procedure for treating breast cancer transplanted mice with 5-FU alone for 2 weeks 5-FU (20 mg/kg/mouse) was administered intraperitoneally to tumor-bearing mice three times a week. The image of the nude mouse is from TogoTV (©2016 DBCLS TogoTV, CC-BY-4.0 https://creativecommons.org/licenses/by/4.0/deed.ja). E, influence of 5-FU treatment on tumor growth rate in MCF-7, MDA-MB-231, and MDA-MB-468-transplanted mice. All breast cancer cells were subcutaneously inoculated into the fat pads of mice. Tumor volume of day 0 is set at 1.0. Values are presented as the mean ± S.D. (n = 6–8). ∗∗p < 0.01 indicates significant differences between the groups (F11,78 = 13.527, p < 0.001 for 4T1; F11,72 = 3.833, p < 0.001 for MCF-7; F11,66 = 11.73, p < 0.001; ANOVA with a Tukey–Kramer post hoc test). F, schematic of the experimental procedure for treating MDA-MB-231 transplanted mice with a combination of MCS and 5-FU for 2 weeks 5-FU (20 mg/kg/mouse) was administered intraperitoneally to tumor-bearing mice three times a week. MCS treatment was performed after 5-FU administration. G, influence of combined MCS and 5-FU treatment on tumor growth rate in MDA-MB-231-transplanted mice. (Saline: n = 8, Saline + MCS: n = 6, 5-FU: n = 8, 5-FU + MCS: n = 8). MDA-MB-231 cells were subcutaneously inoculated into the fat pads of mice. Tumor volume of day 0 is set at 1.0. Values are presented as the mean ± S.D. (n = 6–8). ∗∗p < 0.01 and ∗p < 0.05 indicate significant differences between the groups (F23,156 = 4.514, p < 0.001; ANOVA with a Tukey–Kramer post hoc test). H, immunohistochemical staining of Ki-67 in MDA-MB-231 tumors. Ki-67 signals were visualized using 3,3′-diaminobenzidine (brown), and nuclei were stained with hematoxylin (blue). Values are presented as the mean ± S.D. (n = 5, 6). ∗p < 0.05 indicates a significant difference between the groups (F3,19 = 4.735, p = 0.012; ANOVA with a Tukey–Kramer post hoc test).
Figure 2
Figure 2
MCS induces apoptosis via activation of mutant p53 in MDA-MB-231 cells.A, effect of MCS treatment on MCF-10A and MDA-MB-231 cell viability. Cell viability was assessed 48 h after MCS treatment. The value of the non-MCS-treated group was set at 1.0. Values are presented as the mean ± S.D. (n = 4). ∗∗p < 0.01 indicates significant differences between two groups (t6 = 9.157 for MDA-MB-231; t6 = 10.092 for MDA-MB-468; Student’s t test). B, the protein levels of p53 and p-p53 in MCF-10A and MDA-MB-231 cells. The value of the non-MCS-treated group is set at 1.0. Values are presented as the mean ± S.D. (n = 4). ∗∗p < 0.01 indicates a significant difference between the two groups (t6 = 4.098 for p-p53; Student’s t test). C, effect of MCS treatment on the intracellular concentrations of metal ions in MCF-10A and MDA-MB-231 cells. The value of non-MCS-treated group is set at 1.0. Values are presented as the mean ± S.D. (n = 3–6). ∗p < 0.05 and ∗∗p < 0.01 indicate significant differences from each control (MCF-10A: Intracellular; t10 = 3.323 for Ca; t10 = 4.374 for Fe; t10 = 3.192 for Cu. MDA-MB-231: Intracellular; t7 = 6.157 for Na; t7 = 3.429 for K; t7 = 6.250 for Mg; t7 = 3.726 for Ca; t7 = 9.594 for Mn; t7 = 10.317 for Fe; t7 = 9.197 for Cu; Student’s t test). D, influence of the metal chelator EDTA (1 mM) on the MCS-induced upregulation of intracellular metal ions in MDA-MB-231 cells. The value of non-MCS-treated group is set at 1.0.Values are presented as the mean ± S.D. (n = 4). ∗p < 0.05 indicates a significant difference between the two groups (t6 = 3.623 for Fe; Student’s t test). E, influence of Cu2+ addition to the culture medium on the inhibition of MCS-induced cell proliferation in MDA-MB-231 cells. Cell viability was assessed 48 h after MCS treatment in the presence of CuCl2, with the non-MCS-treated group set at a value of 1.0. Values are presented as the mean ± S.D. (n = 3). ∗∗p < 0.01 indicates significant differences between the two groups (F4,10 = 73.535, p < 0.001; ANOVA with a Tukey–Kramer post hoc test). F, influence of Cu2+ (25 μM) addition to the culture medium on the protein levels of p-p53 in MDA-MB-231 cells. The non-MCS-treated without Cu2+ addition group is set at a value of 1.0. Values are presented as the mean ± S.D. (n = 3–4). ∗∗p < 0.01 indicates a significant difference between the groups (F3,12 = 23.885, p < 0.001 for p-p53; ANOVA with a Tukey–Kramer post hoc test). G, the intracellular ROS levels in MDA-MB-231 cells at 30 min after MCS. The value of the non-MCS-treated group is set at 1.0. Values are presented as the mean ± S.D. (n = 3). ∗p < 0.05 indicates a significant difference between the two groups (t4 = 3.449; Student’s t test). H, influence of N-acetylcysteine (NAC; 5 mM) on the protein levels of p53 and p-p53 in MDA-MB-231 cells. The non-MCS-treated without NAC is set to a value of 1.0. Values are presented as the mean ± S.D. (n = 3–4). ∗∗p < 0.01 indicates a significant difference between the groups (F3,10 = 41.657, p < 0.001 for p-p53; ANOVA with a Tukey–Kramer post hoc test). I, influence of NAC (5 mM) on MCS-induced inhibition of cell proliferation. Cell viability was assessed 48 h after MCS treatment in the presence of NAC. The non-MCS-treated without NAC is set to a value of 1.0. Values are presented as the mean ± S.D. (n = 3). ∗∗p < 0.01 indicates a significant difference between the two groups (F3,8 = 72.645, p < 0.001; ANOVA with a Tukey–Kramer post hoc test). J, effect of MCS treatment on MDA-MB-468 cell viability. Cell viability was assessed 48 h after MCS treatment. The value of the non-MCS-treated group was set at 1.0. Values are presented as the mean ± S.D. (n = 6). ∗∗p < 0.01 indicates significant differences between the two groups (t6 = 10.092; Student’s t test). K, the intracellular ROS levels in MDA-MB-468 cells at 30 min after MCS. The value of the non-MCS-treated group is set at 1.0. Values are presented as the mean ± S.D. (n = 3). ∗p < 0.05 indicates a significant difference between the two groups (t4 = 3.904; Student’s t test). L, the protein levels of p53 and p-p53 in MDA-MB-468 cells. The value of the non-MCS-treated group is set at 1.0. Values are presented as the mean ± S.D. (n = 4). ∗∗p < 0.01 and ∗p < 0.05 indicate significant differences between the two groups (t6 = 2.548 for p53; t6 = 5.161 for p-p53; Student’s t test).
Figure 3
Figure 3
MCS enhances apoptosis induction by 5-FU in MDA-MB-231 cells.A, functional analysis of genes overlapping in two datasets: (1) differential expression between non-MCS-treated and MCS-treated MDA-MB-231 cells, and (2) ChIP-seq data (Antigen: p53, Cell line: MDA-MB-231, criteria: Binding score ≥50) using the gene Ontology Resource in the DAVID system. B, C, mRNA levels of p53 target pro-apoptotic genes BAX, NOXA, and PUMA in MCF-10A and MDA-MB-231 cells at 24 h after MCS. The value of the non-MCS-treated group is set at 1.0. Values are presented as the mean ± S.D. (n = 3–4). ∗p < 0.05 and ∗∗p < 0.01 indicate significant differences between the two groups (t5 = 4.825 for BAX; t5 = 9.861 for NOXA; t5 = 3.554 for PUMA; Student’s t test). D, flow cytometry analysis of annexin V in MCF-10A and MDA-MB-231 cells at 24 h after MCS. The right panel shows the difference in the ratio of Annexin-FITC+/PI- (early apoptosis) to Annexin-FITC+/PI+ (late apoptosis) cell populations between non-MCS-treated and MCS-treated breast cell lines. Values are presented as the mean ± S.D. (n = 3–4). ∗p < 0.05 and ∗∗p < 0.01 indicate significant differences from each control group (t5 = 3.036 for late apoptosis in MCF-10A; t4 = 20.776 for early apoptosis in MDA-MB-231; t4 = 34.180 for late apoptosis in MDA-MB-231; Student’s t test). E, caspase-3/7 activity in MDA-MB-231 cells at 24 h after MCS. Values are presented as the mean ± S.D. (n = 3). The value of the non-MCS-treated group is set at 1.0. ∗∗p < 0.01 indicates a significant difference between the two groups (t4 = 5.728; Student’s t test). F, schematic representation of the human BAX, NOXA, and PUMA genes. The numbers indicate the distance from the transcription start site (+1). Black rectangles represent p53 binding sites. G, ChIP analysis of MCS-induced changes in the binding amount of p53 protein to the upstream regions of BAX, NOXA, and PUMA genes in MDA-MB-231 cells. The value of the non-MCS-treated group is set at 1.0. Values are presented as the mean ± S.D. (n = 4). ∗∗p < 0.01 indicates significant differences between the two groups (t6 = 71.814 for BAX; t6 = 19.936 for NOXA; t6 = 12.871 for PUMA; Student’s t test). H, the promoter activities of the BAX luciferase reporter in MDA-MB-231 cells at 24 h after MCS. The value of the non-MCS-treated group is set at 1.0.Values are presented as the mean ± S.D. (n = 3). ∗∗p < 0.01 indicates a significant difference between the two groups (F5,12 = 17.8, p < 0.001; ANOVA with a Tukey–Kramer post hoc test). I, effect of p53 knockdown on MCS-induced upregulation of BAX luciferase reporter activity in MDA-MB-231 cells. The expression of the p53 protein in the cells is illustrated in Figure S13B. The value of the non-MCS-treated group is set at 1.0. Values are presented as the mean ± S.D. (n = 3). ∗p < 0.05 and ∗∗p < 0.01 indicate significant differences between the groups (F3,8 = 16.7, p = 0.0008; ANOVA with a Tukey–Kramer post hoc test). J, effect of p53 knockdown on MCS-induced pro-apoptotic gene transcription in MDA-MB-231 cells. The value of the sh-Control non-MCS-treated group is set at 1.0. Values are presented as the mean ± S.D. (n = 4). ∗p < 0.05 and ∗∗p < 0.01 indicate significant differences between the groups (F3,12 = 5.595, p = 0.0123 for BAX; F3,12 = 12.731, p = 0.0005 for NOXA; F3,12 = 6.549, p = 0.0072 for PUMA; ANOVA with a Tukey–Kramer post hoc test). K, mRNA levels of p53 target pro-apoptotic genes BAX, NOXA, and PUMA in MDA-MB-468 cells at 24 h after MCS. The value of the non-MCS-treated group is set at 1.0. Values are presented as the mean ± S.D. (n = 3–4). ∗p < 0.05 and ∗∗p < 0.01 indicate significant differences between the two groups (t5 = 4.074 for BAX; t5 = 7.383 for NOXA; t5 = 4.021 for PUMA; Student’s t test). L, effect of p53 knockdown on MCS-induced upregulation of BAX luciferase reporter activity in MDA-MB-468 cells. The expression of the p53 protein in the cells is illustrated in Figure S13C. The value of the non-MCS-treated group is set at 1.0. Values are presented as the mean ± S.D. (n = 3).∗∗p < 0.01 indicates significant differences between the groups (F3,8 = 25.975, p = 0.0002; ANOVA with a Tukey–Kramer post hoc test). M, effect of p53 knockdown on MCS-induced pro-apoptotic gene transcription in MDA-MB-468 cells. The value of the sh-Control non-MCS-treated group is set at 1.0. Values are presented as the mean ± S.D. (n = 3–4). ∗p < 0.05 and ∗∗p < 0.01 indicate significant differences between the groups (F3,12 = 19.236, p < 0.001 for BAX; F3,12 = 20.162, p < 0.001 for NOXA; F3,11 = 3.941, p = 0.0392 for PUMA; ANOVA with a Tukey–Kramer post hoc test).
Figure 4
Figure 4
MCS promotes metal ion influx and activates p53 in MDA-MB-231 cells.A, protein levels of p53, phosphorylated p53 (p-p53), and relative p53 phosphorylation levels in MDA-MB-231 cells treated with MCS and 5-FU (10 μM). The value of the non-MCS-treated without 5-FU treatment group is set at 1.0. Values are presented as the mean ± S.D. (n = 4). ∗∗p < 0.01 indicates a significant difference between the groups (F3,12 = 25.011, p < 0.001 for p-p53; F3,12 = 20.812, p < 0.001 for p-p53/p53; ANOVA with a Tukey–Kramer post hoc test). B, mRNA levels of p53 target genes BAX, NOXA, and PUMA in MDA-MB-231 cells treated with MCS and 5-FU (10 μM). The value of the non-MCS-treated without 5-FU treatment group is set at 1.0. Values are presented as the mean ± S.D. (n = 4). ∗∗p < 0.01 indicates a significant difference between the groups (F3,12 = 34.207, p < 0.001 for BAX; F3,12 = 17.404, p < 0.001 for NOXA; F3,12 = 13.322 for PUMA; ANOVA with a Tukey–Kramer post hoc test). C, influence of MCS on 5-FU-induced apoptosis in MDA-MB-231 cells. Top panels show the flow cytometry analysis of annexin V in non-MCS-treated or MCS-treated MDA-MB-231 cells in the presence or absence of 5-FU. The panel shows the difference in the ratio of FITC+/PI- (early apoptosis) to FITC+/PI+ (late apoptosis) cell populations between non-MCS-treated or MCS-treated MDA-MB-231 cells in the presence or absence of 5-FU. Values are presented as the mean ± S.D. (n = 3). ∗p < 0.05 and ∗∗p < 0.01 indicate a significant difference between the groups (F5,12 = 79.575, p < 0.001 for early apoptosis; F5,12 = 27.343, p < 0.001 for late apoptosis; two-way ANOVA with the Tukey–Kramer post hoc test). D, caspase activity of MDA-MB-231 cells treated with 5-FU and MCS. The value of the non-MCS-treated without 5-FU treatment group is set at 1.0. Values are presented as the mean ± S.D. (n = 3).∗∗p < 0.01 indicates a significant difference between the groups (F5,12 = 62.821, p < 0.001; ANOVA with the Tukey–Kramer post hoc test). p < 0.05 indicates a significant difference from the MCS-treated 5-FU 0 μM group (F2,6 = 5.952, p < 0.0376; ANOVA with Dunnett’s post hoc test). E, influence of MCS on 5-FU-induced apoptosis in MDA-MB-231 tumors. The right panel shows the difference in the ratio of Annexin-FITC+/PI- (early apoptosis) to Annexin-FITC+/PI+ (late apoptosis) cell populations in MDA-MB-231 tumors from each group. Values are presented as the mean ± S.D. (n = 6). ∗p < 0.05 indicates a significant difference from the saline group (F3,20 = 4.590, p = 0.0133; ANOVA with Dunnett’s post hoc test).
Figure 5
Figure 5
Combination of MCS and 5-FU shows a high antitumor effect against 5-FU-resistant cells.A, Cell viability of parental and 5-FU-resistant MDA-MB-231 cells exposed to 5-FU. Cells were treated with 5-FU at concentrations ranging from 0 to 10000 μM for 72 h. The value for each 5-FU-untreated group is set at 1.0. Values are presented as the mean ± S.D. (n = 4). B, protein levels of p53 and phosphorylated p53 (p-p53) following treatment with 5-FU at concentrations ranging from 0 to 100 μM for 48 h. The uncropped image of p53 and p-p53 proteins in the cells is illustrated in Figure S13D. C, Effect of MCS treatment on cell viability in 5-FU-resistant MDA-MB-231 cells. The value for the non-MCS group is set at 1.0. Values are presented as the mean ± S.D. (n = 4). D, mRNA levels of p53 target pro-apoptotic genes BAX, NOXA, and PUMA in non-MCS-treated or MCS-treated 5-FU-resistant MDA-MB-231 cells. The value for the non-MCS group is set at 1.0. Values are presented as the mean ± S.D. (n = 4). ∗p < 0.05 indicates significant differences between the two groups (t6 = 5.535 for BAX; t6 = 7.074 for PUMA; Student’s t test). E, protein levels of p53, phosphorylated p53 (p-p53), and relative p53 phosphorylation levels in 5-FU-resistant MDA-MB-231 cells. The value for the non-MCS group is set at 1.0. Values are presented as the mean ± S.D. (n = 4). ∗∗p < 0.01 indicates a significant difference between the two groups (t6 = 3.416 for phosphorylated p53; t6 = 3.616 for relative p53 phosphorylation; Student’s t test). F, influence of MCS on apoptosis in 5-FU-resistant MDA-MB-231 cells. The left panels show flow cytometry analysis of annexin V in non-MCS-treated or MCS-treated 5-FU-resistant MDA-MB-231 cells. The right panel illustrates the difference in the ratio of FITC+/PI- (early apoptosis) to FITC+/PI+ (late apoptosis) cell populations between non-MCS-treated or MCS-treated 5-FU-resistant MDA-MB-231 cells. The value for the non-MCS group is set at 1.0. Values are presented as the mean ± S.D. (n = 4). ∗∗p < 0.01 indicates a significant difference between the groups (t6 = 4.09 for late apoptosis; Student’s t test). G, caspase activity of parental and 5-FU-resistant MDA-MB-231 cells treated with 5-FU and MCS. The value of the non-MCS-treated without 5-FU treatment group is set at 1.0. Values are presented as the mean ± S.D. (n = 3). ∗∗p < 0.01 indicates a significant difference between the groups (F5,12 = 85.151, p < 0.001; ANOVA with the Tukey–Kramer post hoc test). ††p < 0.01 indicates a significant difference from the MCS-treated 5-FU 0 μM group (F2,6 = 18.866, p < 0.0026; ANOVA with Dunnett’s post hoc test). H, schematic representation of the experimental procedure for treating MDA-MB-231 transplanted mice with 5-FU alone for 2 weeks, followed by a combination of MCS and 5-FU for an additional 2 weeks 5-FU (20 mg/kg/mouse) was intraperitoneally administered to tumor-bearing mice three times a week. MCS treatment was performed after 5-FU administration. I, influence of combined MCS and 5-FU treatment on the tumor growth rate in MDA-MB-231-transplanted mice. Tumor volume at the start of the MCS treatment is set at 1.0. Values are presented as the mean ± S.D. (n = 6–7). ∗∗p < 0.01 indicates significant differences between the groups (F11,66 = 33.965, p < 0.001; ANOVA with a Tukey–Kramer post hoc test). J, tumor weight of MDA-MB-231 tumors treated with a combination of 5-FU and MCS for 2 weeks. Values are presented as the mean ± S.D. (n = 6–7). ∗∗p < 0.01 indicates a significant difference between the two groups (t11 = 3.476; Student’s t test). K, tumor long diameter of MDA-MB-231 tumors treated with a combination of 5-FU and MCS for 2 weeks. Values are presented as the mean ± S.D. (n = 4–7). ∗∗p < 0.01 indicates a significant difference between the two groups (t11 = 4.433; Student’s t test).

Similar articles

References

    1. Albain K.S., Barlow W.E., Shak S., Hortobagyi G.N., Livingston R.B., Yeh I.T., et al. Prognostic and predictive value of the 21-gene recurrence score assay in postmenopausal women with node-positive, oestrogen-receptor-positive breast cancer on chemotherapy: a retrospective analysis of a randomised trial. Lancet Oncol. 2010;11:55–65. - PMC - PubMed
    1. Martin M., Pienkowski T., Mackey J., Pawlicki M., Guastalla J.P., Weaver C., et al. Adjuvant docetaxel for node-positive breast cancer. N. Engl. J. Med. 2005;352:2302–2313. - PubMed
    1. Longley D.B., Harkin D.P., Johnston P.G. 5-fluorouracil: mechanisms of action and clinical strategies. Nat. Rev. Cancer. 2003;3:330–338. - PubMed
    1. Hafner A., Bulyk M.L., Jambhekar A., Lahav G. The multiple mechanisms that regulate p53 activity and cell fate. Nat. Rev. Mol. Cell Biol. 2019;20:199–210. - PubMed
    1. Ju J., Schmitz J.C., Song B., Kudo K., Chu E. Regulation of p53 expression in response to 5-fluorouracil in human cancer RKO cells. Clin. Cancer Res. 2007;13:4245–4251. - PubMed

LinkOut - more resources