. 2025 Jun 26;22(4):510-524.
doi: 10.21873/cgp.20518.

C1orf50 Drives Malignant Melanoma Progression Through the Regulation of Stemness

Affiliations

C1orf50 Drives Malignant Melanoma Progression Through the Regulation of Stemness

Yusuke Otani et al. Cancer Genomics Proteomics. .

Abstract

Background/aim: Recent advancements in omics analysis have significantly enhanced our understanding of the molecular pathology of malignant melanoma, leading to the development of novel therapeutic strategies that target specific vulnerabilities within the disease. Despite these improvements, the factors contributing to the poor prognosis of patients with malignant melanoma remain incompletely understood. The aim of this study was to investigate the role of C1orf50 (Chromosome 1 open reading frame 50), a gene previously of unknown function, as a prognostic biomarker in melanoma.

Materials and methods: We performed comprehensive transcriptome data analysis and subsequent functional validation of the human Skin Cutaneous Melanoma project from The Cancer Genome Atlas (TCGA).

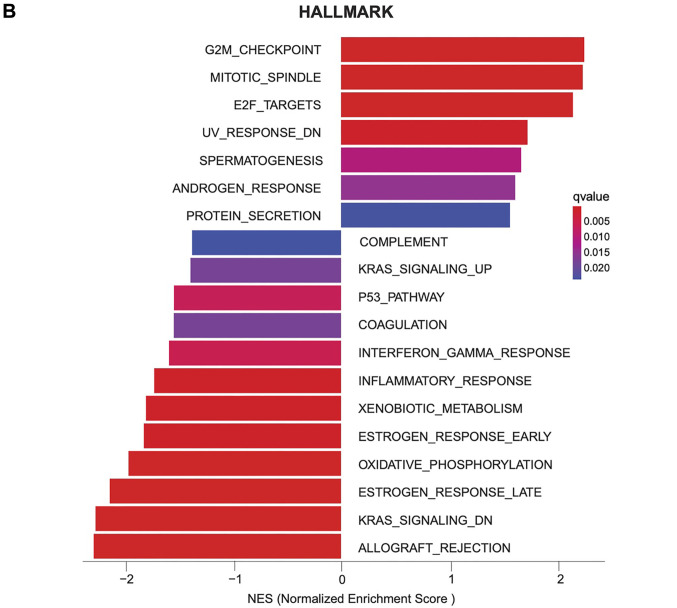
Results: Elevated expression levels of C1orf50 correlated with worse survival outcomes. Mechanistically, we revealed that C1orf50 plays a significant role in the regulation of cell cycle processes and cancer cell stemness, providing a potential avenue for novel therapeutic interventions in melanoma.

Conclusion: This study is the first to identify C1orf50 as a prognostic biomarker in melanoma. The clinical relevance of our results sheds light on the importance of further investigation into the biological mechanisms underpinning C1orf50's impact on melanoma progression and patient prognosis.

Keywords: C1orf50; YAP/TAZ; cancer stem cells; melanoma.


Conflict of interest statement

MHR is a member of Universal DX’s Scientific Advisory Board. However, this company had no influence on support, design, execution, data analysis, or other aspects of this study.

Figures

Figure 1
Figure 1
Analysis of C1orf50 expression and its correlation with clinical and genomic features in primary malignant melanoma. (A) Kaplan–Meier curves for 3-year overall survival in the C1orf50-high and C1orf50-low groups of primary malignant melanoma. (B, C) Mean fluorescence intensity of C1orf50 in primary tumors and lymph node metastases compared to normal tissues. (D) Expression level of C1orf50 in metastatic sites (n=368) versus primary sites (n=103) in the TCGA Skin Cutaneous Melanoma (TCGA-SKCM) dataset. (E) Barplot showing mutation frequencies in the C1orf50-high and C1orf50-low groups. (F) Boxplot depicting changes in C1orf50 values depending on mutations in BRAF, BRAF V600E, NRAS, KIT, NF1, and PTEN. WT: Wild Type, mut: mutation. (G) Heatmap illustrating expression levels of single-base substitutions in COSMIC. (H) Differences between C1orf50-low and C1orf50-high groups in SBS7a and7b. (I) Tumor mutation burden (log10) differences between C1orf50-high and C1orf50-low groups. COSMIC: Catalogue Of Somatic Mutations In Cancer; SBS: single-base substitution.
Figure 1
Figure 1
Analysis of C1orf50 expression and its correlation with clinical and genomic features in primary malignant melanoma. (A) Kaplan–Meier curves for 3-year overall survival in the C1orf50-high and C1orf50-low groups of primary malignant melanoma. (B, C) Mean fluorescence intensity of C1orf50 in primary tumors and lymph node metastases compared to normal tissues. (D) Expression level of C1orf50 in metastatic sites (n=368) versus primary sites (n=103) in the TCGA Skin Cutaneous Melanoma (TCGA-SKCM) dataset. (E) Barplot showing mutation frequencies in the C1orf50-high and C1orf50-low groups. (F) Boxplot depicting changes in C1orf50 values depending on mutations in BRAF, BRAF V600E, NRAS, KIT, NF1, and PTEN. WT: Wild Type, mut: mutation. (G) Heatmap illustrating expression levels of single-base substitutions in COSMIC. (H) Differences between C1orf50-low and C1orf50-high groups in SBS7a and7b. (I) Tumor mutation burden (log10) differences between C1orf50-high and C1orf50-low groups. COSMIC: Catalogue Of Somatic Mutations In Cancer; SBS: single-base substitution.
Figure 2
Figure 2
Gene set enrichment analysis and protein-protein interaction analysis in the C1orf50-high group of primary malignant melanoma. (A) Gene Set Enrichment Analysis (GSEA) of Kyoto Encyclopedia of Genes and Genomes (KEGG) gene sets highlighting pathways enriched in the C1orf50-high group. (B) GSEA of HALLMARK gene sets showing pathways enriched in the C1orf50-high group. (C) Modules created from the top 500 genes with the highest fold change values in the C1orf50-high group compared to the C1orf50-low group, identified through Protein-Protein Interaction analysis.
Figure 2
Figure 2
Gene set enrichment analysis and protein-protein interaction analysis in the C1orf50-high group of primary malignant melanoma. (A) Gene Set Enrichment Analysis (GSEA) of Kyoto Encyclopedia of Genes and Genomes (KEGG) gene sets highlighting pathways enriched in the C1orf50-high group. (B) GSEA of HALLMARK gene sets showing pathways enriched in the C1orf50-high group. (C) Modules created from the top 500 genes with the highest fold change values in the C1orf50-high group compared to the C1orf50-low group, identified through Protein-Protein Interaction analysis.
Figure 3
Figure 3
Correlation of C1orf50 expression with cancer stem cell related genes and YAP/TAZ pathways. (A) Heatmap of cell cycle-related genes and pathways. (B) Comparison of detectable CDK1-9 genes between the C1orf50-high and C1orf50-low groups. (C) Comparison of DNA repair-related genes between the C1orf50-high and C1orf50-low groups. (D) Heatmap of cancer stem cell-related genes and pathways. (E) Comparison of YAP/TAZ-related genes between the C1orf50-high and C1orf50-low groups. (F) Comparison of cancer stem cell-related genes between the C1orf50-high and C1orf50-low groups.
Figure 3
Figure 3
Correlation of C1orf50 expression with cancer stem cell related genes and YAP/TAZ pathways. (A) Heatmap of cell cycle-related genes and pathways. (B) Comparison of detectable CDK1-9 genes between the C1orf50-high and C1orf50-low groups. (C) Comparison of DNA repair-related genes between the C1orf50-high and C1orf50-low groups. (D) Heatmap of cancer stem cell-related genes and pathways. (E) Comparison of YAP/TAZ-related genes between the C1orf50-high and C1orf50-low groups. (F) Comparison of cancer stem cell-related genes between the C1orf50-high and C1orf50-low groups.
Figure 4
Figure 4
Analysis of C1orf50 knockdown effects on stemness and YAP/TAZ pathways in malignant melanoma cells. (A) Representative images of immunoblotting analyses in shRNA-induced melanoma cells. C1orf50 knockdown reduces the expression levels of YAP/TAZ and their targets, AXL and CYR61, and the stemness markers CD133, NESTIN, SOX2, and c-MYC. Note that c-MYC signals were obtained after stripping and re-labeling the TAZ membrane. (B) Sphere formation assays in shRNA-transfected melanoma cells. C1orf50 is required to maintain the self-renewal capacity of melanoma cells. One-way ANOVA (analysis of variance) with Bonferroni’s multiple comparisons was performed. The significance level was defined as **p<0.01, ***p<0.001. (C) Representative immunofluorescent images of siRNA-treated melanoma cells. C1orf50 knockdown attenuated the expression levels of YAP/TAZ and SOX2 in A2058 (left) and Mewo (right) cells. Note that the nuclear YAP/TAZ are merely observed in siC1orf50-treated cells, suggesting that C1orf50 maintains not only YAP/TAZ protein levels, but also YAP/TAZ activity: scale bars, 50 μm. The SOX2 immunostaining signals in Figure 4C were obtained with a combination of anti-SOX-2 goat antibody and anti-goat IgG Alexa Fluor Plus 647 and pseudo-colored with red using the ZEN software. (D) Representative immunofluorescent images of normal skin and melanoma tissues. The expression levels of C1orf50 are higher in the melanoma tissue than in the normal skin. In melanoma tissue, YAP/TAZ nuclear localization and SOX2 expression were enhanced. Scale bars, 50 μm. (E) Scatterplot graphs describing that the mean fluorescence intensity (MFI) of C1orf50 is correlated with that of TAZ (upper), or SOX2 (bottom) in melanoma primary lesions.
Figure 4
Figure 4
Analysis of C1orf50 knockdown effects on stemness and YAP/TAZ pathways in malignant melanoma cells. (A) Representative images of immunoblotting analyses in shRNA-induced melanoma cells. C1orf50 knockdown reduces the expression levels of YAP/TAZ and their targets, AXL and CYR61, and the stemness markers CD133, NESTIN, SOX2, and c-MYC. Note that c-MYC signals were obtained after stripping and re-labeling the TAZ membrane. (B) Sphere formation assays in shRNA-transfected melanoma cells. C1orf50 is required to maintain the self-renewal capacity of melanoma cells. One-way ANOVA (analysis of variance) with Bonferroni’s multiple comparisons was performed. The significance level was defined as **p<0.01, ***p<0.001. (C) Representative immunofluorescent images of siRNA-treated melanoma cells. C1orf50 knockdown attenuated the expression levels of YAP/TAZ and SOX2 in A2058 (left) and Mewo (right) cells. Note that the nuclear YAP/TAZ are merely observed in siC1orf50-treated cells, suggesting that C1orf50 maintains not only YAP/TAZ protein levels, but also YAP/TAZ activity: scale bars, 50 μm. The SOX2 immunostaining signals in Figure 4C were obtained with a combination of anti-SOX-2 goat antibody and anti-goat IgG Alexa Fluor Plus 647 and pseudo-colored with red using the ZEN software. (D) Representative immunofluorescent images of normal skin and melanoma tissues. The expression levels of C1orf50 are higher in the melanoma tissue than in the normal skin. In melanoma tissue, YAP/TAZ nuclear localization and SOX2 expression were enhanced. Scale bars, 50 μm. (E) Scatterplot graphs describing that the mean fluorescence intensity (MFI) of C1orf50 is correlated with that of TAZ (upper), or SOX2 (bottom) in melanoma primary lesions.

References

    1. Benesch MGK, Cherkassky L, Nurkin SJ. Multi-omic analysis: a possible platform toward personalized and adaptable cancer treatment. Ann Surg Oncol. 2024;31(8):4831–4833. doi: 10.1245/s10434-024-15449-9. - DOI - PubMed
    1. Krug K, Jaehnig EJ, Satpathy S, Blumenberg L, Karpova A, Anurag M, Miles G, Mertins P, Geffen Y, Tang LC, Heiman DI, Cao S, Maruvka YE, Lei JT, Huang C, Kothadia RB, Colaprico A, Birger C, Wang J, Dou Y, Wen B, Shi Z, Liao Y, Wiznerowicz M, Wyczalkowski MA, Chen XS, Kennedy JJ, Paulovich AG, Thiagarajan M, Kinsinger CR, Hiltke T, Boja ES, Mesri M, Robles AI, Rodriguez H, Westbrook TF, Ding L, Getz G, Clauser KR, Fenyö D, Ruggles KV, Zhang B, Mani DR, Carr SA, Ellis MJ, Gillette MA, Clinical Proteomic Tumor Analysis Consortium Proteogenomic landscape of breast cancer tumorigenesis and targeted therapy. Cell. 2020;183(5):1436–1456.e31. doi: 10.1016/j.cell.2020.10.036. - DOI - PMC - PubMed
    1. Tanaka A, Ogawa M, Zhou Y, Namba K, Hendrickson RC, Miele MM, Li Z, Klimstra DS, Buckley PG, Gulcher J, Wang JY, Roehrl MHA. Proteogenomic characterization of primary colorectal cancer and metastatic progression identifies proteome-based subtypes and signatures. Cell Rep. 2024;43(2):113810. doi: 10.1016/j.celrep.2024.113810. - DOI - PMC - PubMed
    1. Maekawa M, Tanaka A, Ogawa M, Roehrl MH. Propensity score matching as an effective strategy for biomarker cohort design and omics data analysis. PLoS One. 2024;19(5):e0302109. doi: 10.1371/journal.pone.0302109. - DOI - PMC - PubMed
    1. Tanaka A, Ogawa M, Zhou Y, Otani Y, Hendrickson RC, Miele MM, Li Z, Klimstra DS, Wang JY, Roehrl MH. Proteogenomic characterization of pancreatic neuroendocrine tumors uncovers hypoxia and immune signatures in clinically aggressive subtypes. iScience. 2024;27(8):110544. doi: 10.1016/j.isci.2024.110544. - DOI - PMC - PubMed

Substances

LinkOut - more resources