. 2025 Jun 26;13(6):e011716.
doi: 10.1136/jitc-2025-011716.

Targeting Annexin A2 to reactivate tumor-associated antigens presentation and relieve immune tolerance in liver cancer

Affiliations

Targeting Annexin A2 to reactivate tumor-associated antigens presentation and relieve immune tolerance in liver cancer

Yuxiao Tang et al. J Immunother Cancer. .

Abstract

Background: Tumor cells manipulate the tumor-associated antigens presentation to escape immune surveillance; however, the molecular mechanism is not exactly clear and the measure to intervene is missing.

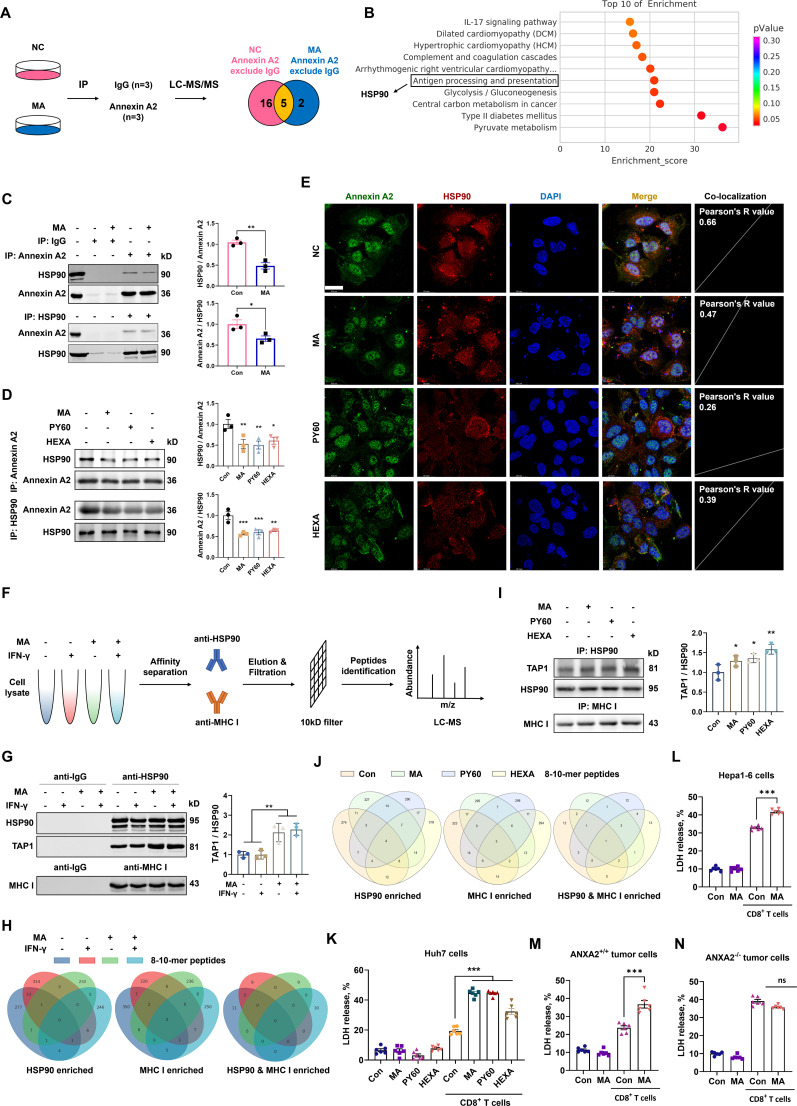
Methods: Annexin A2 was knockout by the CRISPR-Cas9 or blocked by the small-molecule matrine, PY60, and hexapeptide. Chemically and genetically induced primary liver cancer models, and the orthotopically implanted liver tumor model were used. Tumor immune environment was analyzed by single-cell sequencing. Annexin A2-interacted proteins and tumor-associated antigens were identified by co-immunoprecipitation coupled with liquid chromatography with tandem mass spectrometry. Tumor cells killing effects were evaluated by co-culture of tumor cells and CD8+ T cells.

Results: Targeting Annexin A2 effectively suppressed the progression of liver cancer. The immunosuppressive microenvironment was improved by Annexin A2 inhibition in tumor tissues. The CD8+ T cells were increased and activated by targeting Annexin A2. Mechanistically, targeting Annexin A2 inhibited its combination with HSP90. The HSP90-mediated tumor-associated antigens presentation was recovered, and the major histocompatibility complex I-presented short peptides were changed, increasing the tumor cells killing by CD8+ T cells. Interestingly, Annexin A2 was increased in liver cancer tissues and the overall survival was significantly reduced in patients with high expression. However, Annexin A2 was positively correlated with immune cell infiltration in liver cancer, implying that Annexin A2 was used by tumor cells for immune escape and immunotherapy resistance. Hence, we further confirmed that blocking Annexin A2 increased the therapeutic effects of anti-programmed cell death protein-1 both in vitro and in vivo.

Conclusions: Taken together, our results identified the role of Annexin A2 in the tumor-associated antigens presentation and immune evasion, which could be an actionable target in cancer immunotherapy.

Keywords: Hepatocellular Carcinoma; Immune modulatory; Immunotherapy.


Conflict of interest statement

Competing interests: No, there are no competing interests.

Figures

Figure 1
Figure 1. Knockout of Annexin A2 inhibited primary liver cancer. (A) Annexin A2+/+ (ANXA2+/+) or Annexin A2−/− (ANXA2−/−) mice were intraperitoneally injected with 25 mg/kg DEN at 2 weeks of age to induce primary liver cancer at 10 months. Tumor tissues were stained by H&E, scale bar: 100 µm. (B) The tumor incidence was not changed by Annexin A2 knockout in both male and female mice. (C) Tumor weights were decreased by Annexin A2 knockout in male mice. (D) ANXA2+/+ or ANXA2−/− mice were hybridized with miR-122 knockout mice to induce primary liver cancer at 14 months. Tumor tissues were stained by H&E, scale bar: 100 µm. (E) The tumor incidence and (F) tumor weights of miR-122−/−ANXA2+/+ and miR-122−/−ANXA2−/− mice. (G) The serum contents of alpha-fetoprotein (AFP), (H) aspartate aminotransferase (AST), and (I) alanine aminotransferase (ALT) of Annexin A2+/+ or Annexin A2−/− mice with DEN treatment or miR-122 knockout. *p<0.05; ***p<0.001, tested by one-way analysis of variance. n=5 in Annexin A2+/+ or Annexin A2−/− group, n=11 in the Annexin A2+/+ with DEN group, n=13 in the Annexin A2−/− with DEN group, n=10 in the miR-122−/−ANXA2+/+ group, n=19 in the miR-122−/−ANXA2−/− group. DEN, diethylmitrosamine.
Figure 2
Figure 2. Blocking Annexin A2 by matrine suppressed the tumor progression of orthotopically-implanted and primary liver tumors. (A) C57/BL6 mice were orthotopically implanted with luciferase-labeled Hepa1-6 cells and in vivo imaged every 10 days for 50 days. The pictures at the 50-day point were shown. Compared with the control group (MA 0), mice that were treated with matrine (0.2 g/L or 0.4 g/L in drinking water) showed significant reductions in tumor cells of the liver and lung, as confirmed by the luminescent intensity of total tumor cells (B), liver tumor cells (C), and lung tumor cells (D). (E) DEN was used to induce primary liver cancer in C57/BL6 mice. At 9 months, mice were fed matrine 0.4 g/L drinking water for 1 month. Tumor weights were recorded at 10 months. (F) H&E staining of liver tumor tissues. Scale bars: 50 µm. (G) In vivo imaging of C57/BL6 mice implanted with luciferase-labeled Annexin A2+/+ cells or Annexin A2−/− liver tumor cells and received matrine drinking water (0.4 g/L). Pictures were taken every 10 days for 50 days. The 50-day point pictures were exhibited. Luminescent intensity of total tumor cells (H), liver tumor cells (I), and lung tumor cells (J) in mice. *p<0.05; **p<0.01; ***p<0.001, tested by one-way analysis of variance with post hoc Tukey’s multiple comparisons, n=5 in (A) and (G), n=7 in (E). ANXA2, Annexin A2; DEN, diethylmitrosamine; MA, matrine.
Figure 3
Figure 3. Blocking Annexin A2 changed the tumor immune microenvironment and activated CD8+ T cells in vivo. (A) Tumor tissues from diethylmitrosamine-induced primary liver cancer in C57/BL6 mice were prepared for single-cell sequencing (n=3 in each group). A total of 9,340 cells were identified in the control group and 8,508 cells in the MA group. Cells were clustered by cell markers (B). (C) Immune cells were further clustered to subtypes according to immune cell markers (D). (E) The proportions of listed types of immune cells. (F) Volcano plot of gene expressions in CD8+ T cells. (G) KEGG enrichment of upregulated genes in CD8+ T cells. (H) Gene-expression differences in T-cell receptor signaling pathway. (I) Gene-expression differences in the chemokine signaling pathway. Con, control; KEGG, Kyoto Encyclopedia of Genes and Genomes; MA, matrine; t-SNE, T-distributed Stochastic Neighbor Embedding; UMAP, Uniform Manifold Approximation and Projection.
Figure 4
Figure 4. Targeting Annexin A2 increased CD8+ T cells infiltration and activation in liver tumors. (A) The lymphocytes proportions in DEN-induced liver tumors of C57/BL6 mice treated by matrine. (B) The lymphocytes proportions in liver tissues or DEN-induced liver tumors from ANXA2+/+ and ANXA2−/− mice. (C) The lymphocytes proportions in orthotopically-implanted liver tumors of mice treated by matrine. (D) Immunohistochemical staining of CD4, CD8, and NK1.1 in DEN-induced or orthotopically-implanted liver tumor tissues. Scale bar: 50 µm. The expressions of genes involved in the T-cell receptor signaling pathway and chemokine signaling pathway in (E) DEN-induced liver tumors of mice treated by matrine, (F) DEN-induced liver tumors of ANXA2+/+ and ANXA2−/− mice, and (G) orthotopically-implanted tumors of mice treated by matrine. The sample size was the same as above. (H) NCG mice were orthotopically implanted with Hepa1-6-luc cells and received 0.4 g/L matrine drinking water. Mice were in vivo imaged every 10 days for 50 days. Pictures of the 50-day point are shown. (I) H&E staining of tumor tissues in the liver and lung. White bar: 50 µm. Black bar: 500 µm. Luminescent intensity of total tumor cells (J), liver tumor cells (K), and lung tumor cells (L). *p<0.05; **p<0.01; *** p<0.001, tested by one-way analysis of variance with post hoc Tukey’s multiple comparisons, n=5. ANXA2, Annexin A2; DEN, diethylmitrosamine. MA, matrine
Figure 5
Figure 5. Targeting Annexin A2 changed HSP90-mediated tumor-associated antigens presentation and increased tumor cells killing by CD8+ T cells. (A) Huh-7 cells were treated with 20 µM matrine (MA) or negative control (NC). Cell lysates were immunoprecipitated by anti-Annexin A2 or anti-IgG, followed by LC-MS/MS identification. The identified proteins were listed in online supplemental tabe S1. (B) The significant KEGG pathways included antigen processing and presentation, in which HSP90 was involved. (C) Validation of Annexin A2 immunoprecipitation and the decreased combination of Annexin A2 with HSP90 by matrine treatment at 20 µM. (D) The decreased Annexin A2-immunoprecipitated HSP90 and the decreased HSP90-immunoprecipitated Annexin A2 under the treatments of 20 µM matrine, 10 µM PY60, and 10 µM hexapeptide LCKLSL (HEXA). (E) Immunofluorescences and co-localization analysis of Annexin A2 and HSP90 in Huh-7 cells treated with matrine, PY60, and hexapeptide. Scale bar: 23.3 µm. (F) Huh-7 cells were treated with matrine or IFN-γ and the lysates were immunoprecipitated by anti-HSP90 or anti-MHC I. The HSP90- and MHC I-collections were then passed through a 10 kD filter to obtain short peptides for antigen identification. (G) The residue protein samples were determined for HSP90, TAP1, and MHC I by immunoblotting. (H) Venn diagrams of 8-10 mer peptides immunoprecipitated by HSP90 or MHC I. (n=3 in each experiment). (I) The immunoprecipitated HSP90, TAP1, and MHC I under the treatments of matrine, PY60, and hexapeptide. (J) The 8-10 mer peptides immunoprecipitated by HSP90 and MHC I under the treatments of matrine, PY60, and hexapeptide. (K) Tumor cells killing by human naïve CD8+ T cells on Huh-7 cells under the treatments of matrine, PY60, and hexapeptide. (L–N) Tumor cells killing by mouse naïve CD8+ T cells on Hepa1-6 cells (L), ANXA2+/+ cells (M), and ANXA2−/− cells (N). *p<0.05; **p<0.01, tested by t-test, n=6. ANXA2, Annexin A2; IP, immunoprecipitation; LC-MS/MS, liquid chromatography with tandem mass spectrometry; KEGG, Kyoto Encyclopedia of Genes and Genomes; LDH, lactate dehydrogenase; MHC, major histocompatibility complex; TAP1, transporter 1 of antigen peptides.
Figure 6
Figure 6. Expression of Annexin A2 in liver tumors and its relation to immune resistance. (A) The transcript expression of Annexin A2 (ANXA2) in human liver tumors (T, n=369) and adjacent non-tumor tissues (N, n=50). (B) The overall survival of patients with liver cancer in the low ANXA2 expression group (bottom-quartile, n=91) and high ANXA2 expression group (top-quartile, n=91). (C) The mRNA expression and (D) protein expression of Annexin A2 in liver tumor tissues and adjacent non-tumor tissues. n=29. (E) The expressions of cell markers of T cell, B cell, NK cell, macrophage, and DC cell in human liver tumors of low ANXA2 expression group (bottom-quartile, n=91) and high ANXA2 expression group (top-quartile, n=91). The correlations of ANXA2 expression with T-cell markers expressions (F), B-cell markers expressions (G), macrophage markers expressions (H), NK cell markers expressions (I), and DC cell markers expressions (J) in human liver tumors, n=369. (K) The killing of CD8+ T cells on Annexin A2+/+ and ANXA2–/– cells treated with PD-1 antibodies and matrine. PD-1 antibodies were used at 20 µg/mL, matrine was used at 20 µM. (L) Mice were orthotopically implanted with Hepa 1–6 cells and received 200 µg/mouse PD-1 antibodies for three times and 0.4 g/L matrine water. The liver tumors and lung metastatic nodes were recorded. (M) Tumor weights in the liver of mice. (N) H&E staining of the metastatic nodes in the lung of mice. *p<0.05, tested by one-way analysis of variance with post hoc Tukey’s multiple comparisons. DC, dendritic cells; LDH, lactate dehydrogenase; MA, matrine; NK, natural killer; PD-1, programmed cell death protein-1.
Figure 7
Figure 7. Annexin A2 is significantly upregulated in liver tumor tissues and correlated to poor prognosis and immunotherapy resistance. Targeting Annexin A2 by gene knockout or small-molecule blockers reactivated HSP90-mediated tumor-associated antigens presentation. This process sensitized tumor cells to immune surveillance and increased the tumor cells killing by CD8+T cells, thus enhancing the antitumor therapy by immune checkpoint inhibitors. GzmB, Granzyme B; IFN, interferon; MHC, major histocompatibility complex; PD-1, programmed cell death protein-1; PD-L1, programmed death-ligand 1; PFN, perforin; TAP1, transporter 1 of antigen peptides; TCR, T cell receptor

Similar articles

References

    1. Bray F, Laversanne M, Sung H, et al. Global cancer statistics 2022: GLOBOCAN estimates of incidence and mortality worldwide for 36 cancers in 185 countries. CA Cancer J Clin. 2024;74:229–63. doi: 10.3322/caac.21834. - DOI - PubMed
    1. Xue R, Zhang Q, Cao Q, et al. Liver tumour immune microenvironment subtypes and neutrophil heterogeneity. Nature. 2022;612:141–7. doi: 10.1038/s41586-022-05400-x. - DOI - PubMed
    1. Kenison JE, Stevens NA, Quintana FJ. Therapeutic induction of antigen-specific immune tolerance. Nat Rev Immunol. 2024;24:338–57. doi: 10.1038/s41577-023-00970-x. - DOI - PMC - PubMed
    1. Swanton C, Bernard E, Abbosh C, et al. Embracing cancer complexity: Hallmarks of systemic disease. Cell. 2024;187:1589–616. doi: 10.1016/j.cell.2024.02.009. - DOI - PMC - PubMed
    1. Zhang Y, Zhang Z. The history and advances in cancer immunotherapy: understanding the characteristics of tumor-infiltrating immune cells and their therapeutic implications. Cell Mol Immunol. 2020;17:807–21. doi: 10.1038/s41423-020-0488-6. - DOI - PMC - PubMed