. 2025 Jun 26;16(1):5403.
doi: 10.1038/s41467-025-61071-y.

Integrin beta 1 facilitates non-enveloped hepatitis E virus cell entry through the recycling endosome

Affiliations

Integrin beta 1 facilitates non-enveloped hepatitis E virus cell entry through the recycling endosome

Rebecca Fu et al. Nat Commun. .

Abstract

Hepatitis E virus (HEV) is a major cause of acute hepatitis and mainly transmitted faecal-orally. HEV particles present in faeces are naked (nHEV), whereas those found in the blood are quasi-enveloped (eHEV) with a cell-derived lipid membrane. Despite its global health impact, the cellular life cycle of HEV remains poorly understood, particularly regarding the mechanisms of viral entry into host cells. To address this knowledge gap, we develop a high content RNA-FISH-based imaging assay that allows for the investigation of the entry pathways of both naked and quasi-enveloped HEV particles. Surprisingly, we find that integrin α3, previously implicated in nHEV cell entry, is not expressed in the cell types that are most permissive for HEV infection. Instead, we identify integrin β1 (ITGB1) pairing with different α-integrins as the key player mediating nHEV cell entry. Our results indicate that the interaction of nHEV with ITGB1 facilitates entry through Rab11-positive recycling endosomes. In contrast, eHEV particles do not interact with ITGB1 and enter cells using a classical endocytic route via Rab5a-positive early endosomes. The entry of both types of HEV particles requires endosomal acidification and proteolytic cleavage by lysosomal cathepsins, which ultimately results in delivery of the HEV genome to the cytoplasm.


Conflict of interest statement

Competing interests: All authors declare no conflict of interest.

Figures
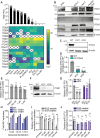
Fig. 1
Fig. 1. ITGB1 heterodimerises with α-integrins in a cell type-dependent manner and mediates nHEV but not eHEV cell.
(A) Heat map showing log2-transformed expression levels of selected integrins in uninfected liver cell lines determined by mass-spectrometry-based proteomics (lower panel, n = 3). Protein levels not detected in at least two replicates were excluded (represented by an X). Cell lines were infected with density gradient-purified nHEV (MOI = 0.1 GE/cell) and infectivity was assessed by staining against HEV ORF2 protein and quantifying FFUs 5 days post-infection (upper panel). n = 9 replicates. (B) Western blot (WB) analysis of hepatoma cell lines and PHH lysates. (C) WB analysis of Huh-7 ITGA2 WT and KO cell lysates. (D) Huh-7 ITGA2 WT and KO cells were infected with nHEV (MOI = 0.1 GE/cell). Infectivity was assessed as in (A). n = 8 replicates. (E) Huh-7 cells were infected with nHEV (MOI = 0.1 GE/cell) in the presence of an integrin α2β1 inhibitor BTT3033 or DMSO. Infectivity was assessed as in (A). n = 9 replicates. (F) WB analysis of S10-3 ITGB1 WT and KO cell lysates. (G) S10-3 ITGB1 WT and KO cells were infected with nHEV (MOI = 0.1 GE/cell) or eHEV particles (MOI = 5 GE/cell). Infectivity was assessed as in (A). n = 6 replicates. (H) S10-3 ITGB1 WT and KO cells were electroporated with an HEV-Gaussia luciferase (GLuc) replicon and HEV replication was quantified by measuring GLuc activity in the supernatant during days 1 to 4 post-electroporation. n = 4 replicates. (I) and (J) S10-3 WT cells were infected with nHEV (MOI = 0.1 GE/cell, n = 6) or eHEV particles (MOI = 5 GE/cell, n = 4) in the presence of an RGD-containing peptide or a scrambled (SCR) control peptide. Infectivity was assessed as in (A). All replicates are from two (B, H, J) or three (A, C, D, E, F, G, I) independent experiments. Statistical analysis was performed by one-way (D, E, G) or two-way ANOVA (I, J). *: p < 0.05; ****: p < 0.0001; ns, non-significant.
Fig. 2
Fig. 2. RNA-fluorescence in situ hybridization allows the detection of single HEV particles.
(A) Scheme of HEV genome organization showing RNA-fluorescence in situ hybridization (RNA-FISH) probes targeting either the full-length genome (green arrow) or the full-length and subgenomic genome (pink arrow). (B) Prechilled hepatoma cells S10-3 were inoculated with nHEV (MOI = 30 GE/cell) or eHEV particles (MOI = 20 GE/cell) and incubated for 2 h and 6 h, respectively, on ice to allow particle binding. The cells were then either fixed or the inoculum removed and shifted to incubation at 37 °C for 6 h to allow particle internalisation. After binding or internalisation, the cells were fixed and stained with DAPI (blue, nucleus) and against ITGB1 (magenta); HEV genomes (green) were detected by RNA-FISH using the ORF1 probe. n = 8 microscope fields (~90 cells). Scale bar = 20 μm. (C) nHEV particles were pre-incubated with convalescent HEV patient serum (1:1000) containing anti-ORF2 antibodies or with non-HEV patient serum as control for 1 h at 37 °C. S10-3 cells were inoculated with mock or serum-treated nHEV (MOI = 30 GE/cell) at 37 °C for 6 h. Cells were then fixed and stained as described in (B). n = 7 microscope fields (~90 cells). Scale bar = 10 μm. (D) S10-3 cells were inoculated with nHEV (MOI = 10 GE/cell) in incubated for 6 h at 37 °C followed by fixation. HEV genomes were detected by RNA-FISH using both ORF1 (green) and ORF2 (magenta) probes. n = 9 microscope fields (~90 cells). Scale bar = 10 μm. All images represent single slices of confocal images. The detected HEV genomes were quantified using CellProfiler. HEV particles per cell were calculated by dividing the total number of detected HEV genomes by the number of nuclei in an image frame. All data are from three independent experiments.
Fig. 3
Fig. 3. ITGB1 interacts with a DGR motif in the protruding capsid domain leading to the internalisation of nHEV particles.
(A) and (B) S10-3 ITGB1 WT and KO cells ± ectopic ITGB1 were inoculated with (A) nHEV (MOI = 30 GE/cell) for (B) 2 h or eHEV (MOI = 20 GE/cell) for 6 h on ice (binding). After inoculum removal, cells were shifted to 37 °C for (A) 6 h or (B) 24 h (internalisation). HEV genomes were detected by RNA-FISH (version 2 kit with ORF1 probe) and quantified using CellProfiler. n = 7 (A) and n = 9 (B) microscope fields (~120 cells). (C) and (D) S10-3 cells were transfected with siRNAs against FAK or a non-target control and 48 h later, (C) harvested for WB or (D) inoculated with nHEV (MOI = 30 GE/cell) or eHEV (MOI = 20 GE/cell). After 8 h at 37 °C, cells were analysed as described in (A). n = 8 microscope fields (~80 cells). (E) Maximum projections of S10-3 cells inoculated with nHEV (MOI = 20 GE/cell) for 2 h on ice. HEV particles (magenta) were visualised by RNA-FISH as in (A), followed by ITGB1 staining (green) and DAPI (blue). (F) Genomes of WT, D522E, and replication incompetent GNN HEV were quantified in electroporated S10-3 cells over time. n = 4 replicates. (G) S10-3 cells were infected with WT or D522E nHEV (MOI = 0.1 GE/cell) and analysed by FFU staining at 5 days post-infection. n = 6 replicates. (H) S10-3 cells were inoculated with WT or D522E nHEV (MOI = 30 GE/cell) for analysis of binding or internalisation as described in (A). n = 10 microscope fields (~80 cells). (I) Spatial arrangement of ITGB1139-380 relative to the ORF2 P-domain dimer (blue). Green models represent interactions with low PAEinter values, red models indicate high PAEinter values (shown in Suppl. Fig. 12C). Close-up view (rendered with PyMol) shows the interface between green ITGB1139-380 models and ORF2-P. (J) S10-3 ITGB1 WT or KO cells were inoculated with WT or D522E nHEV (MOI = 50 GE/cell) for 2 h on ice (binding) and processed for proximity ligation assay. n = 6 microscope fields (controls), n = 12 microscope fields (HEV WT and D522E) (~90 cells). Scale bar=10 μm. All data are from two (F, G, J) or three (A, B, C, D, E, H) independent experiments. Statistical analysis was performed by unpaired two-tailed Student’s t test (G), one-way (A, B, D, J) or two-way ANOVA (H). *: p < 0.05; ***: p < 0.001; ****: p < 0.0001; ns, non-significant.
Fig. 4
Fig. 4. Co-detection of HEV capsid and genome allows analysis of the dynamics of nHEV and eHEV entry.
(A) nHEV particles were immobilized on slides; capsids (magenta) were detected by immunofluorescence (IF) staining and HEV genomes (green) by RNA-FISH (version 1 kit with ORF1 probe). n = 4. Scale bar = 10 μm. (B) S10-3 cells were inoculated with nHEV (MOI = 30 GE/cell) and incubated for 2 h at 4 °C to allow binding (upper image row) followed by inoculum removal and 24 h at 37 °C for internalisation (lower image row). After fixation, cells were stained as described in (A). Line graphs on the right show the fluorescence intensities of capsids and genomes across the region of interest indicated by the white line in the images. Scale bar = 5 μm. (C) S10-3 cells were infected with nHEV (MOI = 50 GE/cell) and harvested after 3 h or 24 h followed by cell fractionation. Equal volumes from each fraction were analysed by WB against Na/K+ ATPase and tubulin. (D) Percentages of HEV genomes in each fraction in cells infected for 3 or 24 h. n = 6. (E) S10-3 cells were inoculated with nHEV (MOI = 30 GE/cell) or eHEV (MOI = 20 GE/cell) for 2 h or 6 h, respectively, followed either by fixation (0 h) or internalisation at 37 °C and fixation at indicated time points. HEV capsids and genomes were detected as described above and quantified using CellProfiler. n = 4 microscope fields for capsid and n = 6 microscope fields for RNA. (D, E) Data presented as mean ± standard derivation (SD). (F) Calculated percentages of HEV genomes colocalising with capsids (from E) out of the total number of detected genomes per cell. n = 4 microscope fields for nHEV and n = 6 microscope fields for eHEV. Statistical analysis was performed by unpaired two-tailed Student’s t test (D) or two-way ANOVA (F). ***: p < 0.001; ****: p < 0.0001; ns, non-significant. Images in (A) and (B) are maximum projections of 4 slices and 2 slices, respectively. All data are from two (A, C, D), three (E, F) or six (B) independent experiments.
Fig. 5
Fig. 5. Both nHEV and eHEV entry depend on endosomal acidification.
(A) and (B) S10-3 cells were treated with indicated concentrations of bafilomycin A (BafA1), concanamycin A (ConA) or DMSO for 30 min prior to infecting with (A) nHEV (MOI = 0.1 GE/cell) or (B) eHEV (MOI = 5 GE/cell). Drugs and virus were removed after 24 h and HEV infection was quantified by counting ORF2-positive FFUs 5 days post-infection. n = 8 (A) or 6 (B). (C) S10-3 cells were treated with 50 nM of bafilomycin A (BafA1) or vehicle control DMSO for 30 min before inoculation with nHEV (MOI = 50 GE/cell). The inoculum was removed 8 h later and replaced with fresh media containing the drug. 24 h later, cells were harvested followed by cell fractionation to extract membranes and the cytosol. Equal volumes from each fraction were separated by SDS-PAGE and probed by Western blotting against the membrane marker Na/K+ ATPase, and the cytosolic marker tubulin. (D) HEV genome copies in each fraction were quantified by RT-qPCR. Shown are percentages of HEV genomes in each fraction in cells treated with BafA1 or DMSO. Data presented as mean ± SD. n = 6 replicates. All data are from two (C, D) or three (A, B) independent experiments. Statistical analysis was performed by comparing HEV RNA in cytosolic fractions by unpaired two-tailed Student’s t test (D) or one-way ANOVA (A, B). *: p < 0.05; **: p < 0.01; ****: p < 0.0001; ns, non-significant.
Fig. 6
Fig. 6. nHEV and eHEV particles use different endocytic pathways.
(A) and (B) S10-3 cells were treated with BafA1, ConA or DMSO for 30 min before inoculation with (A) nHEV (MOI = 30 GE/cell) and (B) eHEV (MOI = 20 GE/cell). The inoculum was removed 8 h later and replaced with fresh media containing the drugs. 24 h later, cells were fixed and HEV capsid and genomes were detected by immunofluorescence staining and RNA-FISH using the ORF1 probe, respectively, and quantified using CellProfiler. Shown are the percentages of HEV genomes colocalising with HEV capsids out of the total number of detected genomes per cell. n = 9 microscope fields. (C) and (D) S10-3 cells were transfected with siRNAs directed against Rab5, Rab7, Rab11 and a NT-control. 48 h post-transfection, cells were inoculated with (C) nHEV (MOI = 30 GE/cell, n = 6 microscope fields) or (D) eHEV (MOI = 20 GE/cell, n = 9 microscope fields) and incubated for 8 h at 37 °C. 24 h post-inoculation, analysis was performed as in (A). (E-G) S10-3 cells ectopically expressing (E) EGFP-Rab5 or (F) EGFP-Rab11 or (G) EGFP-Rab7 were inoculated with nHEV (MOI = 30 GE/cell) or eHEV (MOI = 20 GE/cell) for 2 h or 6 h on ice, respectively, and incubated for (E) 1 h, (F) 15 min, (G) 2 h (nHEV) or 8 h (eHEV) at 37 °C, respectively. Cells were stained against ITGB1 (yellow). HEV genomes (magenta) were visualised as described in (A). Images are representatives of n = 6 microscope fields. Scale bar = 5 μm. All data are from three independent experiments. Statistical analysis was performed by one-way ANOVA (A-D) or unpaired two-tailed Student’s t test (EG). **: p < 0.01; ***: p < 0.001 ****: p < 0.0001; ns, non-significant.
Fig. 7
Fig. 7. nHEV and eHEV particles require lysosomal cathepsin activity for cell entry.
(A) S10-3 LAMP-1-GFP cells were inoculated with eHEV (MOI = 20 GE/cell) or nHEV (MOI = 30 GE/cell) for 6 h or 2 h on ice and incubated at 37 °C for 10 h or 7 h, respectively. Genomes (magenta) were detected by RNA-FISH using the ORF1 probe. Scale bar = 5 μm. (B) and (C) S10-3 cells were treated with cathepsin inhibitor E64 or DMSO and infected with (B) nHEV (MOI = 30 GE/cell, n = 7) or (C) eHEV (MOI = 20 GE/cell, n = 6). E64 was added with virus for 24 h (“during”), or 24 h post-infection and throughout the course of infection (“after”). Infectivity was assessed 5 days post-infection. (D) and (E) S10-3 cells were treated with E64 or DMSO and infected with (D) nHEV (MOI = 30 GE/cell, n = 9) or (E) eHEV (MOI = 20 GE/cell, n = 7). 8 h later, the inoculum was replaced with fresh media containing drugs. 24 h post-inoculation, HEV capsid were detected by staining and genomes as in (A) and quantified using CellProfiler. (F) Maximum projections of E64-treated S10-3 LAMP-1-GFP cells inoculated with nHEV (MOI = 30 GE/cell). 24 h later, capsids (magenta) and genomes (yellow) were detected as in (C). Representative of n = 6 microscope fields. (G) S10-3 LAMP-1-GFP cells were treated with E64 or DMSO 30 min prior to inoculation with nHEV (MOI = 30 GE/cell). After 8 h at 37 °C, inoculum was replaced with fresh media containing drugs. Genomes were detected and analysed as in (A). (H) Proposed working model on HEV cell entry. The interaction of nHEV with ITGB1 triggers internalisation through Rab11+ recycling endosomes, while eHEV is routed into Rab5a+ early endosomes. Both particles traffic through Rab7+ late endosomes and reach Lamp1+ lysosomes. The capsid and envelope are degraded by lysosomal cathepsins, allowing the release of viral genomes into the cytosol through an unknown penetration mechanism. This figure was created in BioRender. Dao Thi, V. (2025). https://BioRender.com/f6k0uqw. All replicates are from three independent experiments. Statistical analysis was performed by unpaired two-tailed Student’s t test (A, D, E) or one-way ANOVA (B, C, G). ****: p < 0.0001; ns, non-significant.

References

    1. Horvatits, T., Schulze Zur Wiesch, J., Lutgehetmann, M., Lohse, A. W. & Pischke, S. The Clinical Perspective on Hepatitis E. Viruses11, 10.3390/v11070617 (2019). - PMC - PubMed
    1. Nimgaonkar, I., Ding, Q., Schwartz, R. E. & Ploss, A. Hepatitis E virus: advances and challenges. Nat. Rev. Gastroenterol. Hepatol.10.1038/nrgastro.2017.150 (2017). - PMC - PubMed
    1. Purdy, M. A. et al. ICTV Virus Taxonomy Profile: Hepeviridae. J. Gen. Virol.98, 2645–2646 (2017). - PMC - PubMed
    1. Fu, R. M., Decker, C. C. & Dao Thi, V. L. Cell Culture Models for Hepatitis E Virus. Viruses11, 10.3390/v11070608(2019). - PMC - PubMed
    1. Das, A. et al. Cell entry and release of quasi-enveloped human hepatitis viruses. Nat. Rev. Microbiol21, 573–589 (2023). - PMC - PubMed

LinkOut - more resources