. 2025 Jun 26;16(1):5369.
doi: 10.1038/s41467-025-60742-0.

Uncovering minimal pathways in melanoma initiation

Affiliations

Uncovering minimal pathways in melanoma initiation

Hui Xiao et al. Nat Commun. .

Abstract

Melanomas are genetically heterogeneous, displaying mitogen-activated protein kinase mutations and homozygous loss of tumor suppressor genes. Mouse models combining such mutations produce fast-growing tumors. In contrast, rare, slow-growing tumors arise in mice combining Braf activation with heterozygous loss of Pten. Here we show that similar tumors can arise in albino mice bearing only a Braf mutation. Incidence kinetics suggest a stochastic event underlies tumorigenesis in tumors that arise with only a Braf mutation, yet de novo mutations or structural variants that could explain the incidence of most tumors could not be found. Single-cell transcriptomics of tumors identify a cell type resembling "neural crest-like" cells in human and mouse melanomas. These exist in normal mouse skin, expand upon Braf activation, and persist through serial transplantation; analyses of gene expression suggest they serve as precursors of malignant cells. This state may serve as an intermediate on a slow path to malignancy that may provide a diagnostically and therapeutically important source of cellular heterogeneity.


Conflict of interest statement

Competing interests: The authors declare no competing interests.

Figures

Fig. 1
Fig. 1. The BrafCA/+ mutation can induce melanomas in mice independently of additional mutations.
a Images and (b) tumor-free survival curves for BrafCA/+ and BrafCA/+; PtenΔ/+ mice in different coat-color backgrounds. Albino BrafCA/+ mice develop tumors not observed in congenic black BrafCA/+ mice. Illustration in (a) was created in BioRender. Shiu, J. (2025) https://BioRender.com/rhuf7aj. Source data are provided as a Source Data file. c Hematoxylin and eosin staining of tumors (representative micrographs of three independent biological replicates are shown). Yellow and black brackets on the side denote tumor-free and tumor-containing regions, respectively. Note that different tumor genotypes differ markedly in pigmentation. PtenΔ/Δ tumors are highly pigmented whereas PtenΔ/+ tumors largely lack pigment. Scale bar: 200 um. d Whole-genome sequencing (WGS) was performed on three albino BrafCA/+ tumors (80X coverage). Observed mutations (intergenic, intronic, exonic, and non-synonymous), including single nucleotide variant (SNV), insertion, deletion, substitution, and stop gain are reported. No non-synonymous mutations were shared amongst the tumors. e The nearest gene bodies to detected copy number variants in albino BrafCA/+ tumors were determined. Only one gene, Thrb, has CNVs close to the gene body in all three tumors. The locations of these CNVs did not suggest functional significance and did not overlap (see Fig. S1D).
Fig. 2
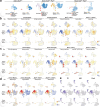
Fig. 2. Single cell transcriptomics identifies melanocyte/neural crest-derived, macrophage, and fibroblast populations in normal skin and BrafCA/+ and BrafCA/+; PtenΔ/+ tumors.
a Coat colors, genotypes and numbers of mice subjected to single-cell RNA sequencing. Created in BioRender. Shiu, J. (2025) https://BioRender.com/2832vxc. b 345,427 cells from 36 mice (47 normal, nevus-containing skin, and melanoma samples) from the genotypes in panel A were subjected to scRNAseq, jointly clustered, and projected onto a common UMAP. ScRNA-seq identified populations enriched in tumors, highlighted in the boxed areas. IRS: Inner root sheath. HF: Hair follicle. EC: Endothelial cell. c NC-derived clusters (identified by the expression of S100b, Dct, Mpz [as well as a Cre-reporter gene in selected cases]) were further subsetted (35,527 cells in total) and populations specific to tissue and coat color were characterized. d Differentially expressed genes associated with NC-derived clusters defined in (c). Known melanoma markers are labeled in black; colored bars and other text colors correspond to labeling in (c). e Gene expression profiles of tumor-enriched fibroblasts (purple), macrophages (brown) and tumor cells (pink) compared among the tumor genotypes. Each column in the heatmap represents a cell from the corresponding group.
Fig. 3
Fig. 3. LNM cells persist after transplantation.
a Tumors derived from BrafCA/+ and BrafCA/+; PtenΔ/+ mouse models were passaged by transplantation onto NSG (immune deficient) mice. Created in BioRender. Shiu, J. (2025) https://BioRender.com/m4kraw3. b Single-cell gene expression profiles were used to subcluster NC-derived cell clusters (32,611 cells), among which principal tumor, melanocyte and LNM clusters were identified. UMAP visualizations of cell-types and sample distribution are shown. rd = Round of transplantation. Tx = transplant. c Gene expression profiles of the NC-derived clusters identified in (b). Gene signatures shared among LNM1 and LNM2 are labeled in black. Each column in the heatmap represents a cell from the corresponding group. d 182,950 cells from BrafCA/+ and BrafCA/+; PtenΔ/+ primary tumors (n = 9) and transplanted NSG tumors (n = 6) were subjected to single-cell RNA-seq. UMAP visualization of cell-types is shown. e Ridge plots of Aqp1 and Sox2 expression. Note the high expression of Aqp1 and Sox2 in both LNM1 and LNM2, compared to other cell types present in the whole skin. Percentages on the side denote the fraction of cells expressing Aqp1 and Sox2 in each cell type, respectively. Exp.: Expression. f Conditional Sox2 deletion in melanocytic/NC-derived cells inhibits tumor development. Tumor incidence in mice of the indicated genotypes is shown, and each dot represents an individual biological replicate; error bars represent the group mean ± SD. Tumor numbers were compared using an unpaired two-tailed t-test. Asterisks denote statistical significance: p < 0.05 (*), p < 0.01 (**); ns: not significant. Source data are provided as a Source Data file.
Fig. 4
Fig. 4. Signatures of NC-derived populations conserved in mouse and human melanoma.
a The tissue source distribution of NC-derived clusters from three genotypes: Albino BrafCA/+ (21,600 cells), Albino BrafCA/+; PtenΔ/+ (5973 cells), and Black BrafCA/+; PtenΔ/+ (3926 cells), is shown. Prolif: proliferating. bd Every cell was assigned a score for how well its gene expression fits a published gene expression signature,,, relative to the other NC-derived cell types (see Methods and Supplementary Data 24) and these were overlayed on the UMAPs for each of the tumor genotypes (color bar denote membership agreement level; red=strong agreement; blue = poor agreement). Gene signatures that aligned primarily with principal tumor cells are shown in (b) those that aligned strongly with LNM cells are shown in (c) and those that aligned with melanocytes are shown in (d). Black dashes outline cell-types in the individual datasets. e Feature plots of expression of selected pigmentation genes in the three tumor datasets. EMT: Epithelial-mesenchymal transitions. NCSC Neural crest stem-cell, Sig signature. Color bar denotes expression level.
Fig. 5
Fig. 5. Evidence that LNM cells are transitional cells.
a As described in Fig. 3a, tumors derived from Black BrafCA/+; PtenΔ/+ were serially passaged by transplantation into NSG (immune deficient) mice. Tumors from one parental Black BrafCA/+;PtenΔ/+ genotype mouse and two serially transplanted NSG mice (derived from a single tumor) were subjected to scRNA-seq, analyzed separately, and the neural crest-derived cells were sub-clustered accordingly (parental black BrafCA/+;PtenΔ/+ tumor: 2686 cells; serially transplanted NSG tumor #1 and #2: 10,662 and 10,965 cells respectively). bd RNA velocity analysis by scVelo predicts fate decisions of individual cells in A using (b) Velocity pseudotime (color bar denotes pseudotime progression), (c) Velocity embedding stream trajectories (note the LNM-to-tumor transition in insets), and (d) Partition-based graph abstraction (PAGA), a topology clustering trajectory method with arrows summarizing directionality from LNM to tumor cells. e Attractors (stable states) were identified by applying MuTrans to the same datasets. f Larger entropy values suggest a more transient cell state. Color bar denotes entropy level. g The dynamical manifold constructed by MuTrans, with potential wells representing stable attractors, and individual cells mapped onto the landscape. h Transition path analysis calculates predicted relative rates of transition between stable attractor states. Note the transition path from the LNM cell attractor to Tumor attractor. The numbers along paths indicate the proportion of total transition flux, with larger values suggesting higher likelihood of transition.
Fig. 6
Fig. 6. Proposed pathways to melanomagenesis.
Skin contains both pigmented melanocytes and rare, poorly-pigmented LNM cells. Upon Braf activation, both populations expand, but melanocytes arrest as nevi, unless loss-of-function mutation in tumor suppressor gene Pten allows them to develop rapidly into pigmented melanomas (Pathway 1). Otherwise, Braf-activated LNM cells can undergo rare, stochastic transitions to produce scantly pigmented melanomas (Pathway 2). The probability of such transitions depends on host pigmentation status, Sox2 expression, and whether both alleles of Pten have become inactivated. LNM cells persist in both types of tumor. Created in BioRender. Shiu, J. (2025) https://BioRender.com/pf330qi.

Update of

References

    1. Hodis, E. et al. A landscape of driver mutations in melanoma. Cell150, 251–263 (2012). - PMC - PubMed
    1. Huang, F. W. et al. Highly recurrent TERT promoter mutations in human melanoma. Science339, 957–959 (2013). - PMC - PubMed
    1. Hayward, N. K. et al. Whole-genome landscapes of major melanoma subtypes. Nature545, 175–180 (2017). - PubMed
    1. Shain, A. H. et al. The genetic evolution of melanoma from precursor lesions. N. Engl. J. Med.373, 1926–1936 (2015). - PubMed
    1. Davies, H. et al. Mutations of the BRAF gene in human cancer. Nature417, 949–954 (2002). - PubMed