. 2025 Jul;27(7):1083-1097.
doi: 10.1038/s41556-025-01693-y. Epub 2025 Jun 26.

A lysosomal surveillance response to stress extends healthspan

Affiliations

A lysosomal surveillance response to stress extends healthspan

Terytty Yang Li et al. Nat Cell Biol. 2025 Jul.

Abstract

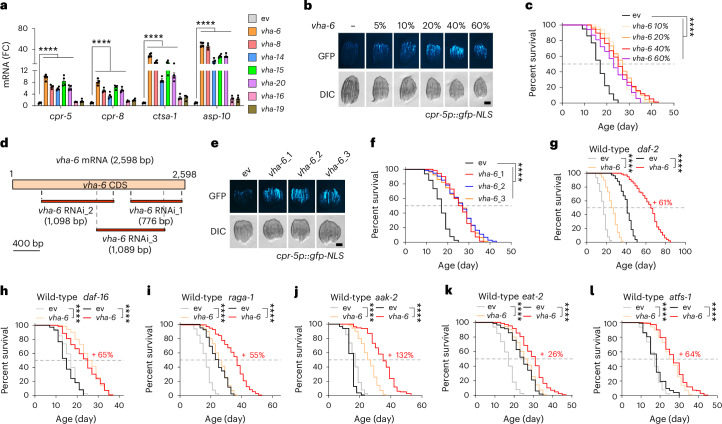
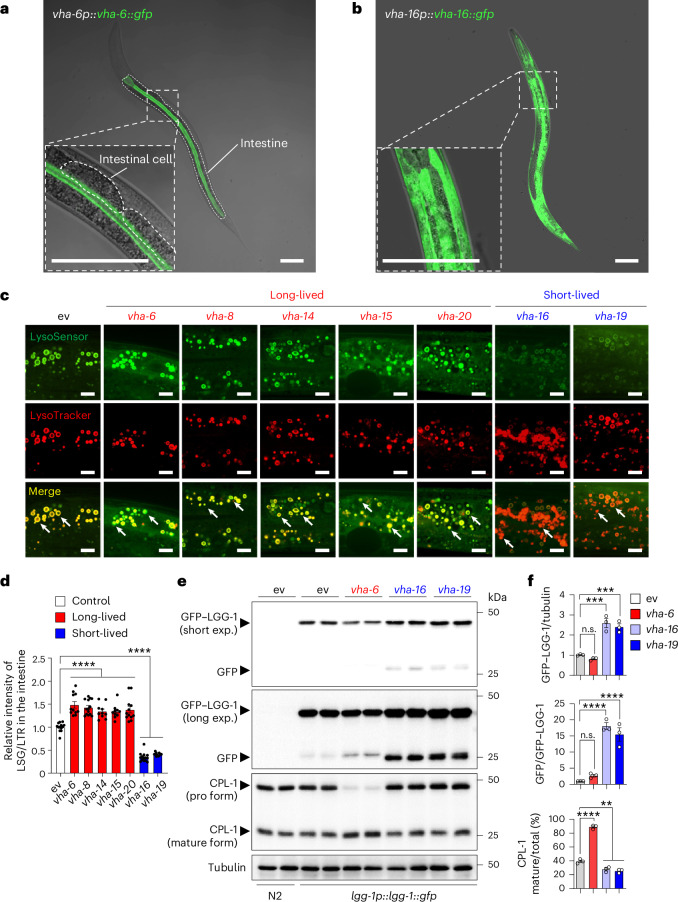
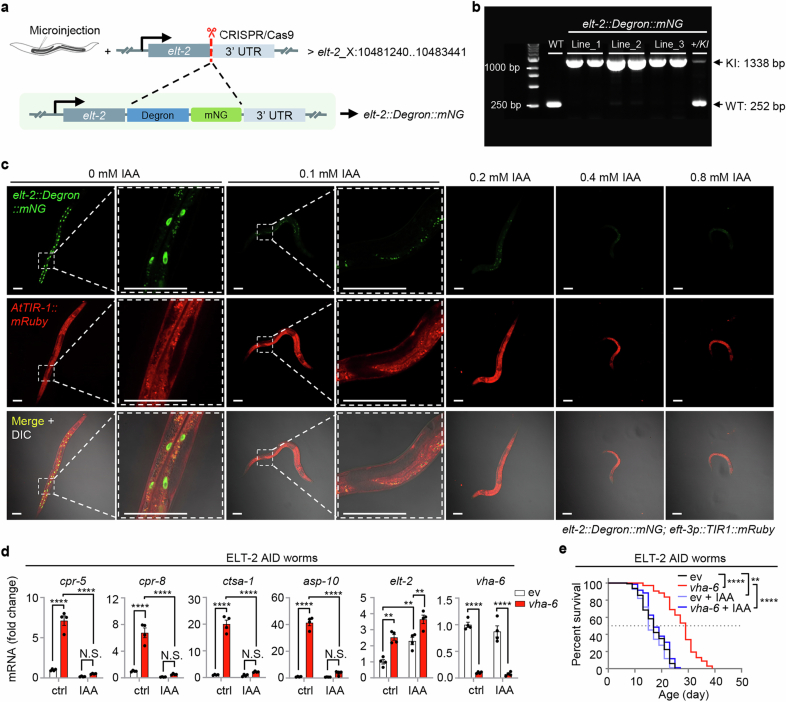
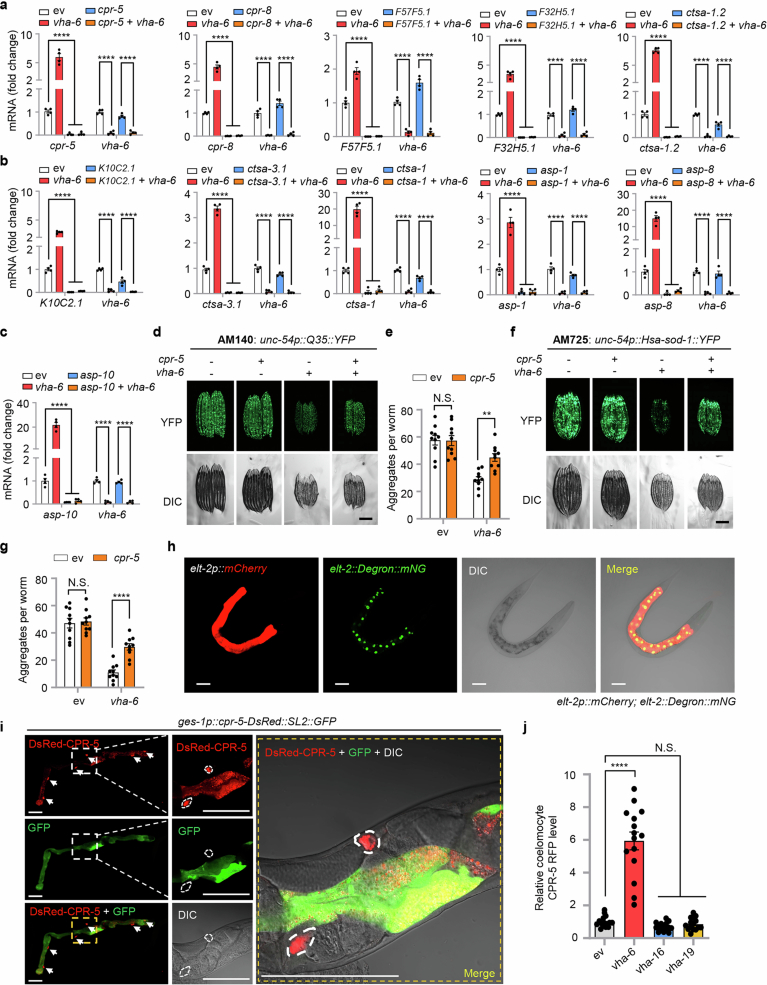
Lysosomes are cytoplasmic organelles central for the degradation of macromolecules to maintain cellular homoeostasis and health. However, how lysosomal activity can be boosted to counteract ageing and ageing-related diseases remains elusive. Here we reveal that silencing specific vacuolar H+-ATPase subunits (for example, vha-6), which are essential for intestinal lumen acidification in Caenorhabditis elegans, extends lifespan by ~60%. This longevity phenotype can be explained by an adaptive transcriptional response typified by induction of a set of transcripts involved in lysosomal function and proteolysis, which we termed the lysosomal surveillance response (LySR). LySR activation is characterized by boosted lysosomal activity and enhanced clearance of protein aggregates in worm models of Alzheimer's disease, Huntington's disease and amyotrophic lateral sclerosis, thereby improving fitness. The GATA transcription factor ELT-2 governs the LySR programme and its associated beneficial effects. Activating the LySR pathway may therefore represent an attractive mechanism to reduce proteotoxicity and, as such, potentially extend healthspan.


Conflict of interest statement

Competing interests: The authors declare no competing interests.

Figures

Fig. 1
Fig. 1. Knockdown of specific v-ATPase subunits extends C. elegans lifespan and activates an adaptive lysosomal surveillance response.
ag, The survival of worms treated with control (ev) or RNAi targeting vha-6 (a), vha-8 (b), vha-14 (c), vha-15 (d), vha-20 (e), vha-16 (f) and vha-19 (g). Each v-ATPase RNAi occupied 40%, except for vha-6, vha-16 and vha-20 RNAi, which occupied 20% (****P < 0.0001). The control RNAi was used to supply to a final 100% of RNAi for all conditions. The percentages indicate the mean lifespan changes relative to control. h, A principal component analysis (PCA) plot of the RNA-seq results of the worms treated with control, vha-6 (long-lived), vha-16 and vha-19 (short-lived) RNAi. PC, principal component. i, Venn diagram of the upregulated differentially expressed genes (DEGs) in response to vha-6, vha-16 and vha-19 RNAi. j, The functional clustering of the 760 DEGs as indicated in i. The P value was derived from DAVID (a one-sided Fisher’s exact test). k, A heat map of the relative expression levels of representative DEGs in response to vha-6, vha-16 and vha-19 RNAi. The colour represents the gene expression differences in log2FC relative to the control RNAi condition. FC, fold change. l, The GFP expression levels of cpr-5p::gfp worms treated with RNAi targeting different v-ATPase subunits. DIC, differential interference contrast; NLS, nuclear localization signal. Scale bar, 0.3 mm. m, Percentages of the mean lifespan change (relative to the ev condition) and GFP intensity of cpr-5p::gfp worms treated with control or RNAi targeting v-ATPase subunits (n = 3 independent experiments). n, The GFP intensity of cpr-5p::gfp worms positively correlates with worm lifespan change. Pearson’s correlation coefficient (r) was calculated with the mean lifespan change values (x axis) and the GFP intensity of cpr-5p::gfp worms (y axis) as indicated in m (two-sided P value). The error bars denote the standard error of the mean. The statistical analysis was performed by a log-rank test in ag. The statistical data for lifespan can be found in Supplementary Table 1. Source data
Fig. 2
Fig. 2. Impact of vha-6, vha-8, vha-14, vha-15, vha-20, vha-16 and vha-19 RNAi on gene expression and lifespan of C. elegans.
a, A qRT–PCR analysis of transcripts (n = 4 biologically independent samples) in worms treated with control (ev) or RNAi targeting v-ATPase subunits (****P < 0.0001). b,c, The GFP–CPR-5 expression level (b) and survival (c) of worms treated with control or 10–60% vha-6 RNAi. The control RNAi was used to supply to a final 100% of RNAi for all conditions (****P < 0.0001). d, A schematic diagram showing the regions on mRNA targeted by the three vha-6 RNAi obtained from either the Vidal (vha-6_1) or Ahringer (vha-6_2, vha-6_3) library. CDS, coding sequence. e,f, The GFP–CPR-5 expression level (e) and survival (f) of worms treated with control or the vha-6 (20%) RNAi as indicated in d (****P < 0.0001). gl, vha-6 RNAi extends the lifespan of daf-2(e1370) (g), daf-16(mu86) (h), raga-1(ok386) (i), aak-2(ok524) (j), eat-2(ad465) (k) and atfs-1(gk3094) (l) mutants by 61%, 65%, 55%, 132%, 26% and 64%, respectively (****P < 0.0001). Scale bars, 0.3 mm. The error bars denote the standard error of the mean. The statistical analysis was performed by ANOVA followed by Tukey’s post hoc test in a or a log-rank test in c and fl. The statistical data for lifespan can be found in Supplementary Table 1. Source data
Fig. 3
Fig. 3. ELT-2 regulates LySR activation and LySR-associated lifespan extension.
a, The most enriched binding motif in the promoters of vha-6 RNAi only 760 genes. The P value was derived from HOMER (a one-sided hypergeometric test). b, The genomic distribution of the motif hits at promoters of vha-6 RNAi only and all other genes. c, RNAi of elt-2 attenuated GFP expression of cpr-5p::gfp worms upon vha-6 RNAi. Scale bar, 0.3 mm. d,e, The western blots (d) and qRT–PCR analysis (e) (n = 4 biologically independent samples) of cpr-5p::gfp worms treated with control, vha-6 and/or elt-2 RNAi (****P < 0.0001; for cpr-5, ***P = 0.0006 (elt-2 versus elt-2+vha-6); for ctsa-1, P = 0.1563 (not significant (n.s.), control (ev) versus elt-2), *P = 0.0136 (elt-2 versus elt-2+vha-6); for asp-10, P = 0.2298 (n.s., ev versus elt-2), P = 0.0798 (n.s., elt-2 versus elt-2+vha-6); for elt-2, ***P = 0.0002 (ev versus vha-6), ***P = 0.0003 (ev versus elt-2), P = 0.1278 (n.s., elt-2 versus elt-2+vha-6)). f, A qRT–PCR analysis (n = 4 biologically independent samples) of worms treated with indicated RNAi (****P < 0.0001; for cpr-5, P > 0.9999 (n.s., elt-2 versus elt-2+vha-8/vha-14/vha-15), P = 0.9999 (n.s., elt-2 versus elt-2+vha-20); for cpr-8, P > 0.9999 (n.s., elt-2 versus elt-2+vha-8), P = 0.9971 (n.s., elt-2 versus elt-2+vha-14), P = 0.9977 (n.s., elt-2 versus elt-2+vha-15), P = 0.9706 (n.s., elt-2 versus elt-2+vha-20)). g, A Venn diagram of DEGs with indicated conditions. h,i, A functional clustering of the 318 (h) and 1,229 (i) DEGs in g. The P value was derived from DAVID (a one-sided Fisher’s exact test). j,k, Western blots (j) and ChIP–qPCR (k) (n = 4 biologically independent samples) of elt-2p::elt-2::gfp-flag worms treated with indicated RNAi (****P < 0.0001). l, The survival of worms treated with indicated RNAi (****P < 0.0001, P = 0.0541 (n.s., elt-2 versus elt-2+vha-6)). The error bars denote the standard error of the mean. The statistical analysis was performed by ANOVA followed by Tukey’s post hoc test in e, f and k or a log-rank test in l. The statistical data for lifespan can be found in Supplementary Table 1. Source data
Fig. 4
Fig. 4. CBP-1 links VHA-6 loss to LySR activation and longevity.
a, All the KATs in C. elegans and their human homologues. b, The identification of CBP-1 as an essential gene for LySR activation. cpr-5p::gfp worms were treated with control (ev) or vha-6 (25%) RNAi in combination with RNAi targeting different KATs (75%). Scale bar, 0.3 mm. c, A shematic diagram showing the different regions targeted by the two different cbp-1 RNAi clones. KIX, kinase-inducible domain interacting domain; Br, bromodomain; HAT, histone acetyltransferase domain; a.a., amino acids; nt, nucleotides. d, A qRT–PCR analysis (n = 4 biologically independent samples) of worms treated with control, cbp-1 and/or vha-6 RNAi (****P < 0.0001; for cpr-5, **P = 0.0091 (ev versus cbp-1_1), **P = 0.0092 (ev versus cbp-1_2); for cpr-8, *P = 0.0315 (ev versus cbp-1_1), *P = 0.0368 (ev versus cbp-1_2); for ctsa-1, P = 0.6009 (not significant (n.s.), ev versus cbp-1_1), P = 0.6595 (n.s., ev versus cbp-1_2); for asp-10, P = 0.9997 (n.s., ev versus cbp-1_1), P = 0.9995 (n.s., ev versus cbp-1_2); for vha-6, **P = 0.0066 (vha-6 versus vha-6+cbp-1_1), **P = 0.0100 (vha-6 versus vha-6+cbp-1_2); for cbp-1, **P = 0.0025 (ev versus cbp-1_2), ***P = 0.0001 (vha-6 versus vha-6+cbp-1_1), *P = 0.0206 (vha-6 versus vha-6+cbp-1_2)). e, H3K27 acetylation increases in a CBP-1-dependent manner during LySR activation induced by vha-6 RNAi. The worms were treated with control, cbp-1 RNAi_1 and/or vha-6 RNAi. f, A ChIP–qPCR (n = 4 biologically independent samples) of elt-2p::elt-2::gfp-flag worms treated with control, vha-6 and/or cbp-1 RNAi_1 (****P < 0.0001). IP, immunoprecipitation. g, The survival of worms treated with control, vha-6 (20%), and/or cbp-1 (50%) RNAi_1 (****P < 0.0001, *P = 0.0102 (cbp-1 versus vha-6+cbp-1)). The error bars denote the standard error of the mean. The statistical analysis was performed by ANOVA followed by Tukey’s post hoc test in d and f or a log-rank test in g. The statistical data for lifespan can be found in Supplementary Table 1. Source data
Fig. 5
Fig. 5. DR partially hijacks the LySR pathway to promote longevity.
a, A schematic diagram for the DR of worms since adult day 1 stage. b, DR mimics vha-6 RNAi and induces LySR activation in C. elegans. A qRT–PCR analysis (n = 4 biologically independent samples) of adult day 2 worms after feeding with ad libitum (AL) (~1.2 × 1010 c.f.u. ml−1), serially diluted HT115 bacteria or no bacteria for 1 day since adult day 1 stage (****P < 0.0001; for cpr-8, ***P = 0.0005 (AL versus DR1); for ctsa-1, ***P = 0.0010 (AL versus DR1), ***P = 0.0001 (AL versus DR2), **P = 0.0039 (AL versus DR3), ***P = 0.0006 (AL versus DR4); for elt-2, **P = 0.0017 (AL versus DR0), **P = 0.0069 (AL versus DR1), ***P = 0.0007 (AL versus DR2/DR3), *P = 0.0336 (AL versus DR4)). c,d, A qRT–PCR analysis (n = 4 biologically independent samples) (c) or the survival (d) of worms treated with control or elt-2 RNAi between L4 to adult day 1 and then transferred to plates with AL (~1.2 × 1010 c.f.u. ml−1) or no bacteria (DR0). Adult day 2 worms were analysed for c (****P < 0.0001) (in d, P = 0.4262 (not significant (n.s.), AL + control (ev) versus AL + elt-2)). e, The survival of eat-2(ad465) worms treated with control or elt-2 RNAi (****P < 0.0001). f, A Venn diagram of the upregulated DEGs in response to DR0 and DR1 as indicated in b and the 760 LySR genes. The 1,020 genes that commonly upregulated upon both DR0 and DR1 were considered as genes upregulated upon sDR. The error bars denote the standard error of the mean. The statistical analysis was performed by ANOVA in b and c or a log-rank test in d and e. The statistical data for lifespan can be found in Supplementary Table 1. Source data
Fig. 6
Fig. 6. LySR activation is featured by boosted lysosomal activity.
a,b, The expression and localization of GFP-tagged VHA-6 (a) and GFP-tagged VHA-16 (b) in transgenic worms. Scale bars, 0.1 mm. c, Confocal fluorescence images of the intestine of worms treated with RNAi targeting different v-ATPase subunits as indicated and then stained by LysoSensor Green (LSG) DND-189 and LysoTracker Red (LTR) DND-99. Each VHA RNAi occupies 20%; control RNAi was used to supply to a final 100% of RNAi for all conditions. The pictures in the same channels were taken at the same settings. Scale bars, 10 μm. d, The relative intensity of LSG/LTR in worms treated with RNAi as indicated in c was quantified (n = 13 worms for ev, n = 11 worms for vha-6/vha-19, n = 14 worms for vha-8/vha-16, n = 10 worms for vha-14/vha-15, n = 12 worms for vha-20) (****P < 0.0001). e, The wild-type N2 or lgg-1p::lgg-1::gfp worms were treated with control, vha-6, vha-16 or vha-19 RNAi and analysed by western blots. exp., exposure. f, Statistical analyses (n = 3 independent experiments) of the relative GFP–LGG-1 expression versus tubulin, GFP versus GFP–LGG-1 and the percentage of mature form of CPL-1 as compared with the total CPL-1 in conditions as shown in e (****P < 0.0001; for GFP–LGG-1/tubulin, P = 0.6346 (not significant (n.s.), ev versus vha-6), ***P = 0.0001 (ev versus vha-16), ***P = 0.0003 (ev versus vha-19); for GFP/GFP–LGG-1, P = 0.6482 (n.s., ev versus vha-6); for CPL-1 mature/total (%), **P = 0.0048 (ev versus vha-16), **P = 0.0016 (ev versus vha-19)). The error bars denote the standard error of the mean. The statistical analysis was performed by ANOVA followed by Tukey’s post hoc test. Source data
Fig. 7
Fig. 7. Activation of LySR reduces protein aggregates and extends healthspan.
ac, A qRT–PCR analysis (n = 4 biologically independent samples) (a), western blots (b), movement (n = 12 individual worms for each condition) and paralysis (n = 4 independent experiments) (c) of CL2122 or GMC101 worms treated with control, vha-6 and/or elt-2 RNAi (****P < 0.0001; in c, *P = 0.0240 (GMC + elt-2 versus GMC + elt-2 + vha-6)). d,e, RNAi of vha-6 (20%) reduces the aggregate formation in unc-54p::Q35::YFP (polyQ model) (d) and unc-54p::Hsa-sod-1::YFP (ALS model) (e) worms (n = 10 individual worms for each condition) (****P < 0.0001; in d, P > 0.9999 (not significant (n.s.), day 1 (D1) ev versus D1 vha-6); in e, P = 0.3577 (n.s., D1 ev versus D1 vha-6), *P = 0.0358 (D1 ev versus D5 ev)). Scale bars, 0.2 mm. f, vha-6 RNAi improves intermediate-term memory in the worm Alzheimer’s disease model GRU102 (unc-119p::Aβ1-42) strain with constitutive neuronal Aβ1-42 expression, analysed at D4 adulthood (n = 15 chemotaxis assays of 50–100 worms for each condition) (*P = 0.0476 (ev versus vha-6), *P = 0.0498 (control versus Aβ1-42), P = 0.9153 (n.s., control + ev versus Aβ1-42+vha-6), **P = 0.0089 (Aβ1-42 + ev versus Aβ1-42+vha-6)). g, Western blots of CL2122 or GMC101 worms treated with control or vha-6 (20%) RNAi combined with RNAi targeting lysosomal protease genes (80%). h, The lifespan of N2 worms treated with control, cpr-5 and/or vha-6 RNAi (****P < 0.0001, P = 0.2547 (n.s., ev versus cpr-5)). ik, The mRNA levels of indicated genes (n = 4 biologically independent samples) (i,j) and movement (n = 12 individual worms for each condition) (k) of N2 worms treated with control or vha-6 RNAi, in combination with elt-2 RNAi, collected at different ages (****P < 0.0001). l, The proposed model for LySR activation and regulation. The error bars denote the standard error of the mean. The statistical analysis was performed by ANOVA followed by Tukey post hoc test in a, cf and ik or a log-rank test in h. The statistical data for lifespan can be found in Supplementary Table 1. Source data
Extended Data Fig. 1
Extended Data Fig. 1. Lifespan and gene expression changes in response to RNAi targeting different v-ATPase subunits in C. elegans.
a-m, Survival of worms treated with control (ev), or RNAi targeting different v-ATPase subunits. Each v-ATPase RNAi occupied 40%, except for vha-11 and vha-12 RNAi, which occupied 10%; control RNAi was used to supply to a final 100% of RNAi for all conditions. The percentages indicate the mean lifespan changes as compared to the control condition (****P < 0.0001; in (b), **P = 0.0015; in (e), **P = 0.0056; in (f), P = 0.0580 (N.S.); in (h), P > 0.9999 (N.S.); in (m), P = 0.7280 (N.S.)). n-s, Transgenic worm strains expressing mCherry tagged VHA-6 (n), and GFP-tagged VHA-14 (o), VHA-15 (p), VHA-16 (q), VHA-20 (r) and VHA-1 (s), were treated with the corresponding VHA RNAi and examined for fluorescence intensity. t, Functional clustering of the 3,322 differentially expressed genes (DEGs) that commonly up-regulated in in response to vha-6, vha-16 and vha-19 RNAi (25%). P. Value was derived from DAVID (one-sided Fisher’s Exact test). u, GFP expression levels of cpr-5p::gfp worms treated with RNAi targeting different v-ATPase subunits. v, vha-6 RNAi (100%) extended wild-type N2 worm lifespan by 26%, even when RNAi treatment started since the L4/young adult stage (****P < 0.0001). Scale bars, 0.3 mm. Statistical analysis was performed by log-rank test (N.S., not significant). Statistical data for lifespan can be found in Supplementary Table 1. Source data
Extended Data Fig. 2
Extended Data Fig. 2. Effect of vha-6 and vha-16 RNAi on gene expression, lifespan, stress responses and fertility.
a, mCherry-VHA-6 expression of worms treated with control or 10%-60% vha-6 RNAi. b,c, GFP-VHA-16 expression (b) and survival (c) of worms treated with control or 10%-60% vha-16 RNAi (****P < 0.0001). d,e, GFP-VHA-16 expression (d) and survival (e) of worms treated with control or 0.1%-10% vha-16 RNAi (****P < 0.0001, *P = 0.0127 (ev VS vha-16 0.5%), P = 0.3713 (N.S., ev VS vha-16 0.1%)). f, RNAi of vha-6 attenuates the mitochondrial stress response activation induced by cco-1 RNAi in hsp-6p::gfp worms. RNAi targeting cco-1 occupies 40%, vha-6 RNAi occupies 20%. g, qRT-PCR analysis (n = 4 biologically independent samples) of worms as indicated in (f) (****P < 0.0001). h,i, RNAi of vha-6 attenuates the ER stress response induced by tunicamycin (5 μg/mL) (h) or hsp-3 RNAi (i) in hsp-4p::gfp worms. j, qRT-PCR analysis (n = 4 biologically independent samples) of worms as indicated in (i) (****P < 0.0001). k, RNAi of vha-6 attenuates the oxidative stress response induced by daf-2 RNAi in sod-3p::gfp worms. RNAi targeting daf-2 occupies 40%, vha-6 RNAi occupies 20%. l, qRT-PCR analysis (n = 4 biologically independent samples) of worms as indicated in (k) (****P < 0.0001). m, RNAi of vha-6 (20%) does not affect the heat shock response activation induced by heat shock (31 °C for 8 h). n, Different developmental stages of vha-6 RNAi treated worms all displayed much higher cpr-5p::gfp induction as compared to that in worms treated with control RNAi, suggesting that the LySR response and body size can be decoupled. o, The rate of egg-laying (n = 5 plates with 3 worms/plate for each condition) at different days of adulthood in worms treated with control, vha-6_1 or vha-6_2 RNAi. RNAi (100%) treatment started since the L4/young adult stage. The total egg output per worm was also calculated (****P < 0.0001, **P = 0.0018 (Day 4, ev VS vha-6_1), *P = 0.0277 (Day 4, ev VS vha-6_2)). Scale bars, 0.3 mm. Error bars denote SEM. Statistical analysis was performed log-rank test (c, e) and ANOVA followed by Tukey post-hoc test (g, j, l, o) (N.S., not significant). Statistical data for lifespan can be found in Supplementary Table 1. Source data
Extended Data Fig. 3
Extended Data Fig. 3. Identification of determinates that regulate LySR activation.
a, The top five enriched motifs for promoters of the 760 up-regulated genes upon vha-6 RNAi, but not upon vha-16 or vha-19 RNAi, by using Hypergeometric optimization of motif enrichment (HOMER) and ranked based on the P values. P. Value was derived from HOMER (one-sided hypergeometric test). b, The similarity of the Rank 1 motif as found in (a) to the putative binding motifs of all known transcription factors in C. elegans. All transcription factors with a similarity score above 0.500 were shown. The GATA transcription factor members were highlighted in bold. c, RNAi of other GATA transcription factor members, or pqm-1, did not affect the GFP expression of cpr-5p::gfp worms induced by vha-6 RNAi. RNAi targeting vha-6 occupied 40%, RNAi targeting GATA transcription factor members, or pqm-1, occupied 60%. d, GFP induction induced by vha-6 RNAi in cpr-5p::gfp worms is not blocked by the knockout of hlh-30 or atfs-1. e,f, Genotyping results for the wild-type, hlh-30(tm1978) (e) and atfs-1(tm4525) (f) strains in a cpr-5p::gfp-NLS background as indicated in (d). g, The indicated autophagy defective mutants have a normal induction of representative lysosomal proteases in response to vha-6 RNAi. qRT-PCR analysis (n = 4 biologically independent samples) of wild-type (N2) or autophagy defect mutants treated with control or vha-6 RNAi (****P < 0.0001). h, ChIP-qPCR (n = 4 biologically independent samples) analyses of the indicated genes in elt-2p::elt-2::gfp-flag worms treated with control or vha-6 RNAi, and/or elt-2 RNAi. ChIP was performed by using IgG control or anti-Flag M2 beads (****P < 0.0001; for hsp-4, P = 0.6641 (N.S., IgG VS ev), P = 0.8960 (N.S., IgG VS vha-6), P > 0.9999 (N.S., IgG VS elt-2), P = 0.9688 (N.S., IgG VS elt-2 + vha-6); for hsp-3, P = 0.5232 (N.S., IgG VS ev), P > 0.9999 (N.S., IgG VS vha-6), P = 0.7291 (N.S., IgG VS elt-2), P = 0.8456 (N.S., IgG VS elt-2 + vha-6); for hsp-16.2, P = 0.8197 (N.S., IgG VS ev), P > 0.9999 (N.S., IgG VS vha-6), P = 0.6324 (N.S., IgG VS elt-2), P = 0.2148 (N.S., IgG VS elt-2 + vha-6); for sod-3, P = 0.9950 (N.S., IgG VS ev), P = 0.9985 (N.S., IgG VS vha-6), P = 0.4144 (N.S., IgG VS elt-2), P = 0.8408 (N.S., IgG VS elt-2 + vha-6); for act-1, P = 0.9714 (N.S., IgG VS ev), P = 0.5075 (N.S., IgG VS vha-6), P = 0.3890 (N.S., IgG VS elt-2), P = 0.8057 (N.S., IgG VS elt-2 + vha-6); for act-3, P = 0.9976 (N.S., IgG VS ev), P > 0.9999 (N.S., IgG VS vha-6), P = 0.8545 (N.S., IgG VS elt-2), P = 0.8580 (N.S., IgG VS elt-2 + vha-6); for ges-1, P = 0.1858 (N.S., ev VS vha-6); for elo-6, P = 0.7980 (N.S., ev VS vha-6), ***P = 0.0003 (vha-6 VS elt-2), ***P = 0.0005 (vha-6 VS elt-2 + vha-6)). Scale bar, 0.3 mm. Error bars denote SEM. Statistical analysis was performed by two-tailed unpaired Student’s t-test (g) or ANOVA followed by Tukey post-hoc test (h) (N.S., not significant). Source data
Extended Data Fig. 4
Extended Data Fig. 4. Auxin-inducible degradation (AID) of ELT-2 mimics the effect of elt-2 RNAi in LySR and lifespan determination.
a, The overall design for CRISPR/Cas9-mediated elt-2::Degron::mNeonGreen knock-in with the endogenous tagging of a Degron-mNeonGreen tag immediately after the last amino acid codon of the elt-2 gene at chromosome X. b, The genotyping results of the wild-type, homozygous and heterozygous elt-2::Degron::mNeonGreen knock-in strains. c, The natural auxin indole-3-acetic acid (IAA) treatment at 0.1-0.8 mM remarkably decreased the Degron-mNG-ELT-2 expression in the elt-2::Degron::mNeonGreen; eft-3p::TIR1::mRuby (ELT-2 AID) worms. Scale bars, 0.1 mm. d, qRT-PCR analysis (n = 4 biologically independent samples) of the ELT-2 AID worms treated with control (ctrl) or 0.1 mM IAA (****P < 0.0001; for cpr-5, P = 0.8422 (N.S., ev + IAA VS vha-6 + IAA); for cpr-8, P = 0.8689 (N.S., ev + IAA VS vha-6 + IAA); for ctsa-1, P = 0.6185 (N.S., ev + IAA VS vha-6 + IAA); for asp-10, P = 0.3410 (N.S., ev + IAA VS vha-6 + IAA); for elt-2, **P = 0.0012 (ev VS vha-6), **P = 0.0043 (ev VS ev + IAA), **P = 0.0033 (ev + IAA VS vha-6 + IAA)). e, Survival of ELT-2 AID worms treated with control or vha-6 (20%) RNAi and/or 0.1 mM IAA (****P < 0.0001, **P = 0.0022 (ev VS ev + IAA)). Error bars denote SEM. Statistical analysis was performed by ANOVA followed by Tukey post-hoc test (d) or log-rank test (e) (N.S., not significant). Statistical data for lifespan can be found in Supplementary Table 1. Source data
Extended Data Fig. 5
Extended Data Fig. 5. Attempts to degrade VHA-6 with the AID/AID2 system.
a, The overall design for CRISPR/Cas9-mediated Degron::mNeonGreen knock-in with the endogenous tagging of a degron-mNeonGreen tag immediately after the last amino acid codon of vha-6 gene at chromosome II. b,c, The experimental flow (b) and genotyping result of the wild-type (+/+), heterozygous (+/KI) and homozygous (KI/KI) vha-6::Degron::mNeonGreen strains (c). d, The natural auxin indole-3-acetic acid (IAA) treatment at 1, 5 or 10 mM since egg stage barely reduced the expression level of Degron-mNeoGreen tagged VHA-6 in vha-6::Degron::mNeonGreen; eft-3p::TIR1::mRuby worms. vha-6 RNAi (20%) was used as a positive control. e, IAA at 1 mM remarkably decreased the Degron-mNeoGreen-DAF-16 expression in daf-16::Degron::mNeonGreen; eft-3p::TIR1::mRuby worms. f, 1-naphthaleneacetic acid (NAA) treatment at 1-10 mM since egg stage barely reduced the expression level of degron-mNeoGreen tagged VHA-6 in vha-6::Degron::mNeonGreen; eft-3p::TIR1::mRuby worms. g, The IAA derivative phenyl-indole-3-acetic acid (5-Ph-IAA) treatment at 5 or 10 μM since egg stage barely reduced the expression level of degron-mNeoGreen tagged VHA-6 in vha-6::Degron::mNeonGreen; eft-3p::TIR1(F79G)::mRuby worms. Scale bars, 0.2 mm. Source data
Extended Data Fig. 6
Extended Data Fig. 6. The impact of elt-2 overexpression and analysis of ELT-2 localization.
a, Heat-map of the relative expression of representative LySR genes in control or elt-2 overexpression (OE) worms at young (L4) or aged (Day 13) stage based on an extant RNA-seq dataset (GSE69263). The color represents gene expression differences in log2(fold change, FC). b,c, Representative images of GFP-tagged ELT-2 and DAPI staining in elt-2p::elt-2::gfp-flag worms treated with control or vha-6 RNAi. Scale bars, 10 μm for (b) and 0.1 mm for (c). The quantification panel indicates the distribution of DAPI or ELT-2 signal in intestinal nuclei in elt-2p::elt-2::gfp-flag worms treated with control (ev) or vha-6 RNAi. Image voxels were ranked by DAPI intensity within each nucleus and divided into 4 equal-volume bins. Percentage of total DAPI intensity in each of the bins was measured (n = 30 nuclei for each condition) (****P < 0.0001, **P = 0.0037 (Bin 3, ev VS vha-6), P = 0.8625 (N.S., Bin 4, ev VS vha-6)). Boxes and lines represent interquartile range (IQR) and median, respectively; whiskers represent min to max. Statistical analysis was performed by ANOVA followed by Tukey post-hoc test (N.S., not significant). Source data
Extended Data Fig. 7
Extended Data Fig. 7. Expression pattern of VHA-6 and VHA-16, and effect of different v-ATPase RNAi on intestinal pH.
a-d, Transgenic worm strains expressing vha-6 promoter-driven mCherry and GFP-tagged VHA-6 (a), GFP-tagged VHA-14 (b), VHA-15 (c) and VHA-20 (d). Scale bars, 0.1 mm. e,f, The effect of different v-ATPase RNAi on intestinal lumen pH, as revealed by Oregon Green-dextran 488 staining (e). Scale bars, 0.1 mm. Worms treated with vha-6, vha-8, vha-14, vha-15 and vha-20 RNAi show brighter green fluorescence, indicating higher intestinal lumen pH. The relative intensity of Oregon Green-dextran 488 (n = 15 individual worms for each condition) is shown in (f). Each VHA RNAi occupies 20%, control RNAi was used to supply to a final 100% of RNAi for all conditions (****P < 0.0001, P = 0.9637 (N.S., ev VS vha-16), P = 0.9980 (N.S., ev VS vha-19)). g,h, The single staining of worms by LysoSensor Green (g) and LysoTracker Red (h) validates that the fluorescent signal from each channel is specific for the corresponding dye applied. Scale bars, 10 μm. i,j, LysoTracker Red staining of worms treated with control (ev), vha-16 or vha-19 RNAi. Each VHA RNAi occupies 20% or 60%, control RNAi was used to supply to a final 100% of RNAi for all conditions (i). When indicated, worms were pretreated with v-ATPase inhibitor Bafilomycin A1 (BafA1) (0.2 mM, 2 h) prior to the addition of LysoTracker Red. Scale bars, 10 μm. The relative average intensity of LysoTracker for each animal is shown in (j) (15 animals were scored for each condition) (****P < 0.0001, P = 0.6753 (N.S., in ctrl, ev VS vha-16 20%), P = 0.4511 (N.S., in ctrl, ev VS vha-19 20%), P = 0.9963 (N.S., in BafA1, ev VS vha-16 20%), P = 0.9726 (N.S., in BafA1, ev VS vha-16 60%), P = 0.9999 (N.S., in BafA1, ev VS vha-19 20%), P = 0.9978 (N.S., in BafA1, ev VS vha-19 60%)). k,l, Confocal fluorescence images indicating the acidification states of the lysosomes revealed by the pHTomato-tagged NUC-1 controlled by the heat-shock hsp-16.2 promoter (k). The relative intensity of pHTomato per lysosome is shown in (l) (n = 45 independent worm images for each condition) (****P < 0.0001). Scale bars, 0.1 mm. Error bars denote SEM. Statistical analysis was performed by ANOVA followed by Tukey post-hoc test (N.S., not significant). Source data
Extended Data Fig. 8
Extended Data Fig. 8. LySR activation enhances aggregation clearance and extends healthspan.
a, qRT-PCR analysis (n = 4 biologically independent samples) of CL2122 and GMC101 worms cultured at two different temperatures since Larval 4 (L4) stage (****P < 0.0001; for cpr-5 at 20 °C, *P = 0.0174; for cpr-8 at 20 °C, ***P = 0.0001; for ctsa-1 at 20 °C, **P = 0.0054). b, Western blots of CL2122 or GMC101 worms treated with control (ev), vha-6_1 or vha-6_2 RNAi, cultured at two different temperatures since L4 stage. c, Chloroquine (CQ) treatment led to strong accumulation of amyloid-β aggregates and almost completely blunted vha-6 RNAi induced amyloid-β aggregation clearance. Western blots of GMC101 worms treated with control or vha-6 RNAi and treated with or without CQ at a final concentration of 1 mM or 5 mM. d, Survival of worms treated with control or vha-6 RNAi, and treated with or without CQ at 1 mM (left) or 5 mM (right) (****P < 0.0001, P = 0.8085 (N.S., vha-6 VS vha-6 + 1 mM CQ)). e,f, RNAi of vha-6 (20%) reduces disease-causing protein aggregate formation in unc-54p::Q35::YFP (Huntington’s disease polyQ model) (e) and unc-54p::Hsa-sod-1::YFP (ALS model) (f) worms. g, Worms expressing either unc-54p::Q35::YFP (polyQ model) (left) or unc-54p::Hsa-sod-1::YFP (ALS model) (right) were treated with control or vha-6 (20%) RNAi and/or 1-5 mM CQ, analyzed at Day 5 of adulthood. h, Paralysis (n = 10 independent worm plates for each condition) (left), or movement (n = 12 individual worms for each condition) (right) of worms as indicated in (e) and (f), respectively (****P < 0.0001). Scale bars, 0.3 mm. Error bars denote SEM. Statistical analysis was performed by two-tailed unpaired Student’s t-test (a), log-rank test (d), or ANOVA followed by Tukey post-hoc test (h) (N.S., not significant). Statistical data for lifespan can be found in Supplementary Table 1. Source data
Extended Data Fig. 9
Extended Data Fig. 9. Role of lysosomal proteases in LySR activation and vha-6 RNAi-induced beneficial effects.
a-c, Knockdown validations with qRT-PCR analysis (n = 4 biologically independent samples) of worms treated with RNAi as indicated (****P < 0.0001). d-g, Worms expressing either unc-54p::Q35::YFP (polyQ model) (d and e) or unc-54p::Hsa-sod-1::YFP (ALS model) (f and g) were treated with control, cpr-5 and/or vha-6 RNAi, and analyzed at Day 5 of adulthood (n = 10 individual worms for each condition). RNAi targeting cpr-5 occupied 80%, vha-6 RNAi occupied 20%. Control RNAi was used to supply to a final 100% of RNAi for all conditions (****P < 0.0001; in (e), P = 0.9999 (N.S., ev VS cpr-5), **P = 0.0037 (vha-6 VS vha-6 + cpr-5); in (g), P = 0.9999 (N.S., ev VS cpr-5)). Scale bars, 0.3 mm. h, Transgenic worm strains expressing elt-2 promoter-driven mCherry and Degron-mNG-tagged ELT-2. Scale bars, 0.1 mm. i, The expression pattern of intestine-specific ges-1 promoter-driven DsRed-CPR-5 and GFP in ges-1p::cpr-5::DsRed;SL-2::GFP worms. The CPR-5-DsRed is localized not only in the intestine but also in the six coelomocytes (white arrows and in dashed circles). The gene expression of cpr-5 is indicated by polycistronic GFP, while the CPR-5 protein is visualized by its RFP fusion. Scale bar, 100 μm. j, The level of secreted CPR-5-RFP fusion is increased by vha-6 RNAi, but not by vha-16 or vha-19 RNAi (n = 15 individual worms for each condition) (****P < 0.0001, P = 0.8769 (N.S., ev VS vha-16), P = 0. 9843 (N.S., ev VS vha-19)). Error bars denote SEM. Statistical analysis was performed by ANOVA followed by Tukey post-hoc test (N.S., not significant). Source data
Extended Data Fig. 10
Extended Data Fig. 10. Impacts of hlh-30 and pha-4 inactivation in vha-6 RNAi-induced LySR activation and lifespan extension.
a, qRT-PCR analysis (n = 4 biologically independent samples) of GMC101 worms treated with control (ev), hlh-30 and/or vha-6 RNAi. RNAi targeting hlh-30 occupied 80%, vha-6 RNAi occupied 20%. Control RNAi was used to supply to a final 100% of RNAi for all conditions (****P < 0.0001; for cpr-5, P = 0.9991 (N.S., ev VS hlh-30), P = 0.8633 (N.S., vha-6 VS vha-6 + hlh-30); for cpr-8, P = 0.9912 (N.S., ev VS hlh-30), P = 0.9908 (N.S., vha-6 VS vha-6 + hlh-30); for hlh-30, ***P = 0.0004 (ev VS hlh-30); for vha-6, P = 0.7724 (N.S., ev VS hlh-30), P = 0.9869 (N.S., vha-6 VS vha-6 + hlh-30)). b, Western blots of CL2122 or GMC101 worms treated with control, hlh-30 and/or vha-6 RNAi. c, Worms expressing unc-54p::Q35::YFP (polyQ model) were treated with control, hlh-30 and/or vha-6 RNAi, and analyzed at Day 5 of adulthood (n = 10 individual worms for each condition) (P = 0.9604 (N.S., ev VS hlh-30), P = 0.7285 (N.S., vha-6 VS vha-6 + hlh-30)). Scale bars, 0.3 mm. d, qRT-PCR analysis (n = 4 biologically independent samples) of unc-54p::Q35::YFP worms treated with RNAi as indicated (****P < 0.0001). e, Worms expressing unc-54p::Hsa-sod-1::YFP (ALS model) were treated with control, hlh-30 and/or vha-6 RNAi, and analyzed at Day 5 of adulthood (n = 10 individual worms for each condition) (P = 0.6603 (N.S., ev VS hlh-30), P = 0.9307 (N.S., vha-6 VS vha-6 + hlh-30)). Scale bars, 0.3 mm. f, qRT-PCR analysis (n = 4 biologically independent samples) of unc-54p::Hsa-sod-1::YFP worms treated with RNAi as indicated (****P < 0.0001). g, Survival of wild-type and hlh-30(tm1978) worms treated with control or vha-6 (20%) RNAi (****P < 0.0001, *P = 0.0109 (tm1978 ev VS vha-6)). h, Survival of wild-type and pha-4(zu225);smg-1(cc546ts) temprature sensivie (TS) worms treated with control or vha-6 (20%) RNAi. Lifespan was conducted at 15°C after the first day of adulthood to inactivate pha-4. Note that similar impacts of vha-6 RNAi on lifespan were found in wild-type and pha-4 TS mutant worms, as compared to their own control RNAi conditions. Wild-type worms live longer than normal as the experiments were conducted at 15°C instead of 20°C (****P < 0.0001). Error bars denote SEM. Statistical analysis was performed by ANOVA followed by Tukey post-hoc test (a, c-f), or log-rank test (g, h) (N.S., not significant). Statistical data for lifespan can be found in Supplementary Table 1. Source data

References

    1. Mutvei, A. P. et al. Balancing lysosome abundance in health and disease. Nat. Cell Biol.25, 1254–1264 (2023). - PubMed
    1. Saftig, P. & Puertollano, R. How lysosomes sense, integrate, and cope with stress. Trends Biochem. Sci.46, 97–112 (2021). - PMC - PubMed
    1. Ballabio, A. & Bonifacino, J. S. Lysosomes as dynamic regulators of cell and organismal homeostasis. Nat. Rev. Mol. Cell Biol.21, 101–118 (2020). - PubMed
    1. Lawrence, R. E. & Zoncu, R. The lysosome as a cellular centre for signalling, metabolism and quality control. Nat. Cell Biol.21, 133–142 (2019). - PubMed
    1. Settembre, C. & Perera, R. M. Lysosomes as coordinators of cellular catabolism, metabolic signalling and organ physiology. Nat. Rev. Mol. Cell Biol.25, 223–245 (2024). - PubMed

MeSH terms

Substances

LinkOut - more resources