. 2025 Oct;21(10):1325-1350.
doi: 10.1038/s44320-025-00127-z. Epub 2025 Jun 26.

Compensatory evolution to DNA replication stress is robust to nutrient availability

Affiliations

Compensatory evolution to DNA replication stress is robust to nutrient availability

Mariana Natalino et al. Mol Syst Biol. 2025 Oct.

Abstract

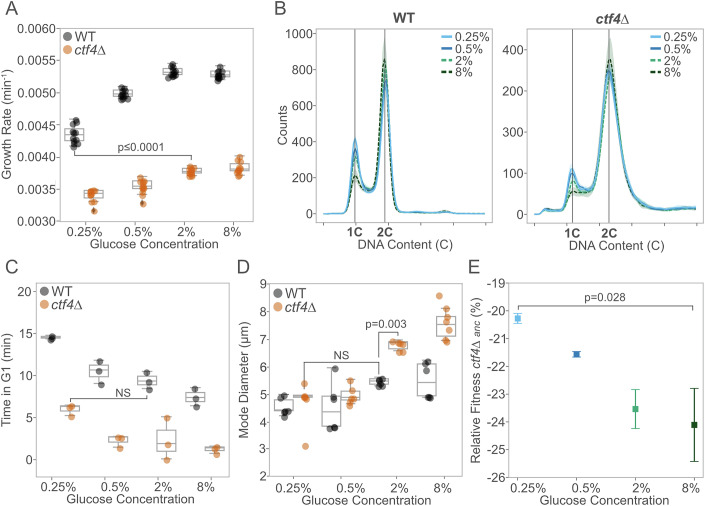
Evolutionary repair refers to the compensatory evolution that follows perturbations in cellular processes. While evolutionary trajectories are often reproducible, other studies suggest they are shaped by genotype-by-environment (GxE) interactions. Here, we test the predictability of evolutionary repair in response to DNA replication stress-a severe perturbation impairing the conserved mechanisms of DNA synthesis, resulting in genetic instability. We conducted high-throughput experimental evolution on Saccharomyces cerevisiae experiencing constitutive replication stress, grown under different glucose availability. We found that glucose levels impact the physiology and adaptation rate of replication stress mutants. However, the genetics of adaptation show remarkable robustness across environments. Recurrent mutations collectively recapitulated the fitness of evolved lines and are advantageous across macronutrient availability. We also identified a novel role of the mediator complex of RNA polymerase II in adaptation to replicative stress. Our results highlight the robustness and predictability of evolutionary repair mechanisms to DNA replication stress and provide new insights into the evolutionary aspects of genome stability, with potential implications for understanding cancer development.

Keywords: S. cerevisiae; Compensatory Evolution; DNA Replication Stress; Genome Maintenance; Nutrients.


Conflict of interest statement

Disclosure and competing interests statement. The authors declare no competing interests.

Figures

Figure 1
Figure 1. Glucose concentration impacts cell physiology in the presence of DNA replication stress.
(A) Population growth rates (min−1) of ancestral WT (black) and ctf4∆ mutant (orange) across different glucose concentrations (n = 12 biological replicates, Mann–Whitney U test with BH correction) (WT 0.25% vs ctf4∆ 2%, P value = 6.47 × 10−5). (B) Cell cycle profiles of ancestral WT (left) and ctf4Δ (right) across glucose concentrations. Colors represent different glucose concentrations: blue refers to glucose starvation (light blue for 0.25%, dark blue for 0.5%), while green refers to glucose abundance (light green for 2%, dark green for 8%). Bold lines indicate mean profiles, and shaded areas represent standard deviation (SD) (n = 3 biological replicates). 1C and 2C indicate DNA content in G1 and G2/M phases, respectively. (C) Time spent (minutes) in G1 phase for ancestral WT and ctf4Δ, across different glucose concentrations, estimated from DNA content and doubling times (see “Methods”, n = 3 biological replicates, ANOVA Tukey’s HSD). (D) Mode cell diameter of ancestral WT and ctf4Δ across different glucose concentrations (n = 6 biological replicates, ANOVA Tukey’s HSD). (E) Mean relative fitness of ancestral ctf4∆ relative to reference WT across different glucose concentrations. Colors represent glucose concentration. Error bars represent SD (n = 4 biological replicates, Mann–Whitney U test). Box plots in (A, C, D) represent the median (center line), 25th and 75th percentiles (lower and upper bounds of the box), and whiskers extending to the smallest and largest values within 1.5× the interquartile range (IQR) from the lower and upper quartiles, respectively. Data points beyond whiskers are shown as outliers. Detailed statistical analysis and underlying data for this figure are provided in Source Data. Source data are available online for this figure.
Figure 2
Figure 2. Glucose availability impacts the dynamics of fitness recovery.
(A) Schematic of experimental layout. 48 isogenic clones of ancestral ctf4∆ and 48 WT clones were inoculated in either glucose starvation (0.25% and 0.5%) or abundance (2% and 8%) on deep 96-well plates. Clones were grown to saturation and diluted daily until reaching 1000 generations. The bottleneck was adjusted to maintain Ne within the same order of magnitude throughout the experiment. (B) Mean adaptation rate (% fitness gain per generation) for ancestral WT (top) and ctf4∆ mutant (bottom) across glucose concentrations. Adaptation rate was calculated as the fitness difference between the evolved population and their ancestor (∆), divided by the total number of generations elapsed (1000). Box plots represent the median (center line), 25th and 75th percentiles (lower and upper bounds of the box), and whiskers extending to the smallest and largest values within 1.5× the IQR from the lower and upper quartiles, respectively. Data points beyond whiskers are shown as outliers (n = 3 replicas per population, Mann–Whitney U test with BH correction). (C) Fitness trajectories of WT (upper panel) and ctf4∆ (lower panel) populations evolved across varying glucose concentrations. Individual population data are shown as shaded lines, while mean fitness values are displayed as solid lines, with error bars representing standard deviations (SD) (n = 3 replicas per population). Individual trajectories were modeled using a power law function (see “Methods”). The dashed purple line depicts the power law fit of the mean trajectory. Line colors correspond to glucose concentrations as follows: light blue (0.25%), dark blue (0.5%), light green (2%), and dark green (8%). Detailed statistical analyses, underlying data, and estimated parameters are provided in Source Data. Source data are available online for this figure.
Figure 3
Figure 3. The mutational profile is mainly influenced by the genotype.
(A) Total detected mutations in CDS per evolved WT (black) and ctf4∆ (orange) populations, at generation 1000 (n = 12 for individual populations, Mann–Whitney U test was used to compare mutational counts (CDS)) (WT vs ctf4∆, P value = 1.38 × 10−14). (B) Distribution of mutated read fractions across glucose concentrations for WT (left) and ctf4∆ (right) evolved populations, used as a proxy for clonality. Mutation fraction (%) was calculated as the fraction of reads from whole-population sequencing that contained a particular mutation in CDS. Colors represent glucose concentrations: light blue (0.25%), dark blue (0.5%), light green (2%), dark green (8%). Histograms are overlaid with a kernel density estimate (KDE, colored lines) to illustrate frequency distributions. Kolmogorov–Smirnov (KS) test was used to compare read fraction distributions between glucose concentrations and genotypes. (C) Total mutations detected in CDS across glucose concentrations for WT (left) and ctf4∆ (right) populations at generation 1000 (n = 12 for individual populations). Kruskal–Wallis test was performed to assess the effect of glucose concentration on mutation counts for WT and ctf4∆. Box plots in (A, C) represent the median (center line), 25th and 75th percentiles (lower and upper bounds of the box), and whiskers extending to the smallest and largest values within 1.5× the IQR from the lower and upper quartiles, respectively. Data points beyond whiskers are shown as outliers. Detailed statistical analysis and underlying data for this figure are provided in Source Data. Source data are available online for this figure.
Figure 4
Figure 4. Environment impacts the genetic basis of adaptation of WT but not the replication stress mutant.
(A) Venn diagram of putative adaptive genes mutated in evolved WT populations across glucose concentrations (upper panel). Colors represent glucose concentrations: light blue (0.25%), dark blue (0.5%), light green (2%), and dark green (8%). Numbers represent counts of putative adaptive genes (excluding zero counts). Gene names in the center are shared across conditions. GO terms enriched across glucose concentrations in WT (bottom panel). Heatmap illustrates the total number of gene hits for significant GO terms. Fisher’s Exact Test was used to assess the significance between pairwise glucose conditions. (B) Venn diagram of putative adaptive genes mutated in evolved ctf4∆ populations across glucose concentrations (upper panel) and corresponding GO term enrichment heatmap (bottom panel). (C) Simplified interaction network (curated in Cytoscape, (Shannon et al, 2003)) of mutations detected in ctf4∆ evolved populations. Dark gray lines represent known genetic and physical interactions from the literature (STRING database, (Szklarczyk et al, 2023)). Node diameter corresponds to the total number of mutations (hits) detected in the coding region of each gene. Nodes are color-coded: blue for mutations in low glucose (0.25% and 0.5%), green for high glucose (2% and 8%), light orange for both high and low glucose, and dark orange for all conditions. Nodes with a bold outline indicate putative adaptive genes in at least one condition. Shaded clusters represent Gene Ontology (GO) term enrichment for biological processes obtained using STRING database. Detailed statistical analysis and underlying data for this figure are provided in Source Data. Source data are available online for this figure.
Figure 5
Figure 5. Adaptive fitness and structural insights of Med14 mutation in replication stress mutants.
(A) Schematic representation of the prevalence of the med14-H919P point mutation in evolved ctf4∆ populations across glucose conditions. (B) Mean relative fitness of ctf4∆ ancestor (orange) and ctf4∆ carrying reconstructed mutation med14-H919P (pink). Error bars represent SD (n = 3 biological replicates, Mann–Whitney U test with BH correction). (C) Composite model of the transcription pre-initiation complex of RNA pol II with mediator complex forming a dimer to act on a distal promoter (Gal4-activated, PDB: 7UIO). Tail components, RNA pol II, transcription factors (TFs), DNA, and regulatory Gal4 are color-coded. Med14 is highlighted in pink, with secondary structures shown for the C-terminal domain (705–1082 aa). Right panel: top view of HIS 919 (blue) and surrounding amino acids, with a simulation of the His to Pro substitution at site 919. Structural clashes were identified using ChimeraX (affected residues in yellow). (D) Mean relative fitness of mutants in chromatin cohesion (chl1∆), nucleotide production (dun1∆), and transcription replication conflicts (rnh1rnh201∆ and sen1-3) alone (white) or in combination with med14-H919P mutation (light pink). Error bars represent SD (n = 4 biological replicates). (E) Genetic interaction network centered on med14-H919P. Node color represents the sign and strength of epistasis. Epistasis was calculated as the difference between observed and expected fitness (additive model). Detailed statistical analysis and underlying data for this figure are provided in Source Data. Source data are available online for this figure.
Figure 6
Figure 6. Robustness in core genetics of adaptation to replication stress.
(A) Distribution of core adaptive mutations in IXR1, RAD9, MED14 and SCC2 genes across glucose conditions. Pie chart sizes are proportional to the number of populations carrying each mutation in the gene. Numbers indicate the mutations detected across glucose concentrations, color-coded as light blue (0.25%), dark blue (0.5%), light green (2%), and dark green (8%). (B) Correlation between the fraction of populations in each glucose condition carrying a specific adaptive mutation and the fitness benefit of the mutation in a ctf4Δ background under the same glucose condition. Colors refer to genes: ixr1Δ (blue), rad9Δ (red), med14-H919P (purple), and 2xSCC2 (gray). A positive correlation (R2 = 0.88) is observed, with the shaded area representing the 95% confidence interval of the linear regression. (C) Comparison of ancestral, reconstructed core mutations, evolved, and computed fitness for ctf4∆ lines. For each evolved population, if a reconstructed gene was found mutated, its fitness effect in the respective glucose concentration was added to the ctf4∆ ancestor to calculate computed fitness (blue). Relative fitness of evolved ctf4∆ populations (orange, n = 3 replicates per population), reconstructed quintuple (ixr1rad9∆ 2xSCC2 med14-H919P ctf4∆, yellow star, n = 4 biological replicates) and ancestral ctf4∆ (dark orange, n = 4 biological replicates) are shown. Error bars represent SD. P values indicate the likelihood that evolved fitness is higher than core reconstructed mutants (one-sided t test). (D) Mean relative fitness of ctf4Δ and the reconstructed strain (ctf4Δ ixr1Δ rad9Δ 2xSCC2). Error bars represent standard deviation (SD) (n = 3 biological replicates). Each point shows the mean fitness for a specific nutrient and concentration (low or high), with marker shapes distinguishing genotypes (squares for ctf4∆ and inverted triangles for the reconstructed strain) and colors indicating nutrient concentration levels (light blue for low, dark green for high). Mann–Whitney U test used to compare ctf4∆ and reconstructed in each nutrient. Detailed statistical analysis and underlying data for this figure are provided in Source Data. Source data are available online for this figure.
Figure EV1
Figure EV1. Glucose concentration impacts growth dynamics in the presence of DNA replication stress.
(A) Population doubling time (min) of ancestral WT (black) and ctf4∆ mutant (orange) across different glucose concentrations (n = 12 biological replicates, Mann–Whitney U test with BH correction, P value = 6.47 × 10−5). (B) Growth curves of ancestral WT (solid line) and ctf4∆ (dashed line) over 30 h. Colors represent different glucose concentrations: light blue (0.25%), dark blue (0.5%), light green (2%), and dark green (8%). Bold lines indicate mean growth; shaded areas represent SD (n = 12 biological replicates). (C) Time spent (minutes) in G2/M phase for ancestral WT and ctf4Δ, across different glucose concentrations, estimated from DNA content and doubling times (see “Methods”, n = 3 biological replicates, ANOVA Tukey’s HSD) (WT 0.25% vs WT 8%, P value = 2.10 × 10−05). Box plots in (A, C) represent the median (center line), 25th and 75th percentiles (lower and upper bounds of the box), and whiskers extending to the smallest and largest values within 1.5× the IQR from the lower and upper quartiles, respectively. Detailed statistical analysis and underlying data for this figure are provided in Source Data. Source data are available online for this figure.
Figure EV2
Figure EV2. Evolutionary dynamics under different glucose concentrations.
(A) Estimated Ne across generations. Solid and dashed lines represent, respectively, adjusted Ne values for WT and ctf4∆ populations across generations. Colors represent different glucose concentrations: light blue (0.25%), dark blue (0.5%), light green (2%), and dark green (8%). (B) Relative fitness at generation 1000 for evolved WT (left panel, black) and ctf4∆ (right panel, orange) populations (n = 3 replicates per population, Mann–Whitney U test with BH correction). (C) Relative fitness recovery at generation 1000 for evolved ctf4∆ (orange) populations. Percentage of fitness recovery was calculated by dividing the fitness gains (∆) by the ancestral fitness (n = 3 replicates per population). (D) Absolute fitness gains (∆) at generation 1000 for evolved ctf4∆ (orange) populations, per glucose concentration. Absolute fitness gains were calculated by subtracting ancestral relative fitness from evolved populations’ relative fitness (Δ = evo% - anc%), both calculated as percentages relative to the same reference strain in the same glucose concentration. (n = 3 replicates per population). (E) Parameter b from power law fit of fitness trajectories of populations across glucose concentrations (n = 3 replicates per population, Mann–Whitney with BH correction, P value = 2.19 × 10−4). (F) Correlation between the absolute fitness gains (∆) during evolution and the fitness defect of ancestor strain in each glucose concentration. Colors represent different glucose concentrations: light blue (0.25%), dark blue (0.5%), light green (2%), and dark green (8%). Pairwise comparisons were performed using the Mann–Whitney test with Bonferroni correction. Box plots in (BE) represent the median (center line), 25th and 75th percentiles (lower and upper bounds of the box), and whiskers extending to the smallest and largest values within 1.5× the IQR from the lower and upper quartiles, respectively. Detailed statistical analysis and underlying data for this figure are provided in Source Data. Source data are available online for this figure.
Figure EV3
Figure EV3. Mutational counts.
(A) Total counts of synonymous (syn) mutations detected in evolved WT and ctf4∆ populations. Mann–Whitney U test was used to compare mutational counts. (B) Median mutation fraction (%) in CDS for evolved WT (black) and ctf4∆ (orange) populations at generation 1000 (n = 12 individual populations). Mann–Whitney U test was used to compare medians. (C) Median mutation fraction (%) of CDS mutations per glucose concentration, for WT (left) and ctf4∆ (right) at generation 1000. Statistical analysis was performed using the Mann–Whitney U test with BH correction. Box plots in (B, C) represent the median (center line), 25th and 75th percentiles (lower and upper bounds of the box), and whiskers extending to the smallest and largest values within 1.5× the IQR from the lower and upper quartiles, respectively. Detailed statistical analysis and underlying data for this figure are provided in Source Data. Source data are available online for this figure.
Figure EV4
Figure EV4. Disruption of MED14 tail leads to reduced RNR1 expression.
(A) Volcano plot of transcriptional changes after degron-mediated removal of Med14 C-terminal (Warfield et al, 2022). Dashed purple line indicates the significance threshold (P value ≤ 0.01). Differentially expressed genes were identified based on two criteria: (1) an adjusted P value < 0.01, ensuring statistical significance, and (2) an absolute log2 fold change >1, corresponding to at least a twofold change in expression. Data analysis was performed using DESeq2. GO term enrichment analysis of downregulated genes highlights the carbohydrate (light pink) and nucleotide (magenta) metabolic processes. Detailed statistical analysis and underlying data for this figure are provided in Dataset EV1. (B) Overexpression of RNR1 or its allele refractory to feedback inhibition (rnr1-D57N) under the Gal promoter in WT, ctf4∆ and ctf4ixr1∆ backgrounds. Tenfold serial dilutions of the indicated strains were spotted onto media containing either galactose (inducing) or glucose (repressing) and incubated at 30 °C for 48 h. Overexpression of rnr1-D57N exacerbates the growth defects of both ctf4∆ and ctf4ixr1∆.
Figure EV5
Figure EV5. Fitness of reconstructed strains.
(A) Mean relative fitness of reconstructed putative adaptive mutations in WT background. Error bars represent SD. Colors indicate glucose concentrations: light blue (0.25%), dark blue (0.5%), light green (2%), and dark green (8%) (n = 4). (B) Changes in mean relative fitness of ancestral ctf4∆ clones carrying reconstructed putative adaptive mutations (Δ = |anc %|-|reconstructed %|). Error bars represent standard deviation, with errors propagated from the two fitness measurements used to calculate fitness change (Δ) (n = 4). (C) Frequencies of adaptive mutations across glucose concentrations at 1000 generations. Each bar represents the 12 parallel populations evolved in each glucose concentration, by order (1 to 12). Allele frequencies (mean fraction) in populations were derived from deep sequencing data of genomic DNA extracted from a population sample. Statistical analysis was performed using Mann–Whitney test to compare high and low glucose effect on fitness. Detailed statistical analysis and underlying data for this figure are provided in Source Data. Source data are available online for this figure.

Update of

References

    1. Aguilera A, García-Muse T (2012) R loops: from transcription byproducts to threats to genome stability. Mol Cell 46:115–124 - PubMed
    1. Alberghina L, Smeraldi C, Ranzi BM, Porro D (1998) Control by nutrients of growth and cell cycle progression in budding yeast, analyzed by double-tag flow cytometry. J Bacteriol 180:3864–3872 - PMC - PubMed
    1. Alsina A, Fumasoni M, Sartori P (2025) Model-based inference of cell cycle dynamics captures alterations of the DNA replication programme. bioRxiv10.1101/2025.03.19.644216v1
    1. Appanah R, Lones EC, Aiello U, Libri D, De Piccoli G (2020) Sen1 is recruited to replication forks via Ctf4 and Mrc1 and promotes genome stability. Cell Rep 30:2094–2105.e9 - PMC - PubMed
    1. Ardell SM, Martsul A, Johnson MS, Kryazhimskiy S (2024) Environment-independent distribution of mutational effects emerges from microscopic epistasis. Science 386:87–92 - PMC - PubMed

MeSH terms

LinkOut - more resources