Review
. 2025 Jun 26;192(7):457.
doi: 10.1007/s00604-025-07267-x.

Future perspectives of GMO detection in agriculture: strategies for electrochemical nucleic acid detection

Affiliations
Review

Future perspectives of GMO detection in agriculture: strategies for electrochemical nucleic acid detection

Ana Kuprešanin et al. Mikrochim Acta. .

Abstract

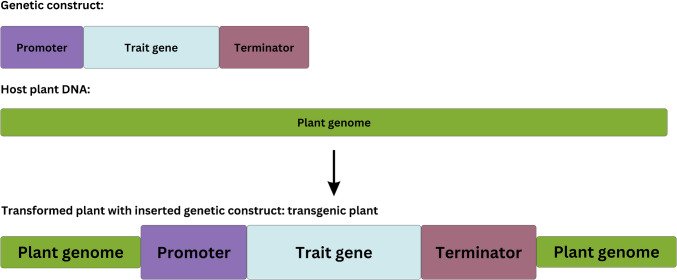
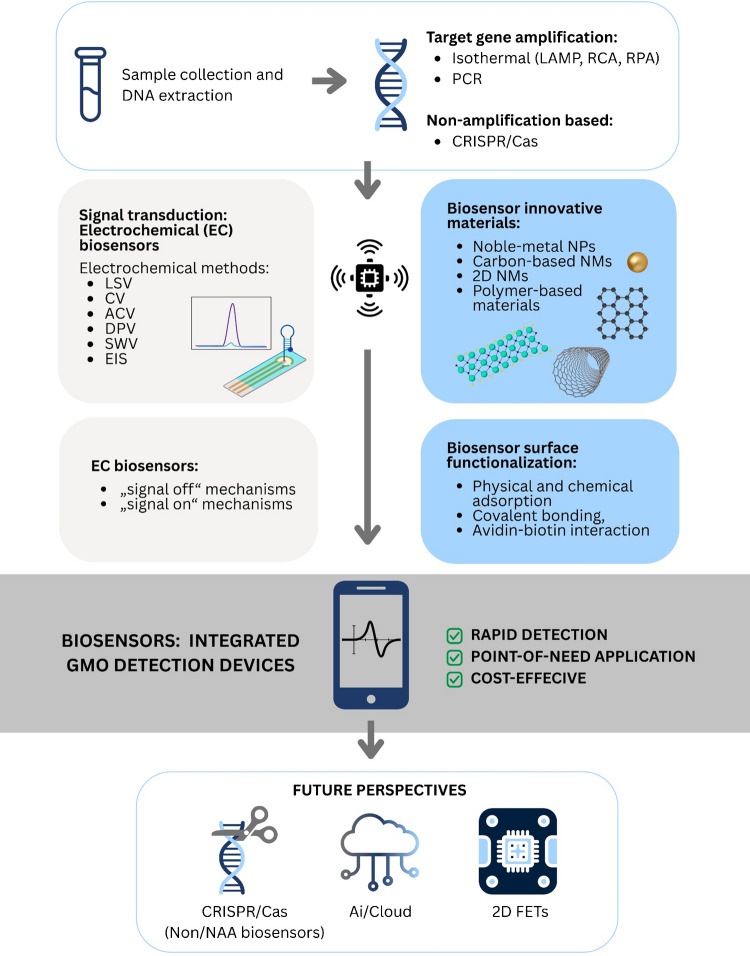
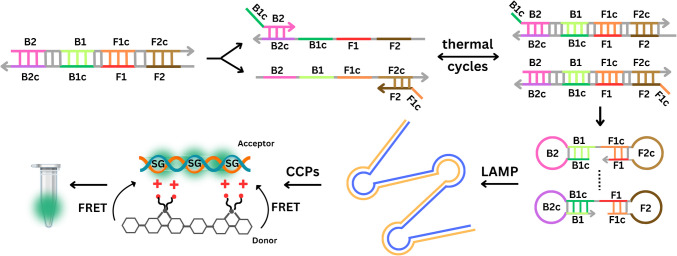
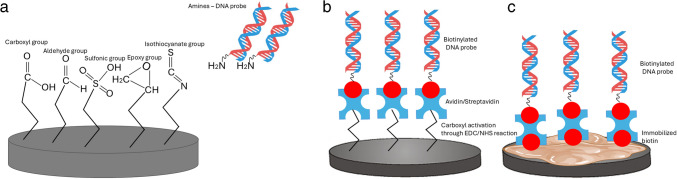
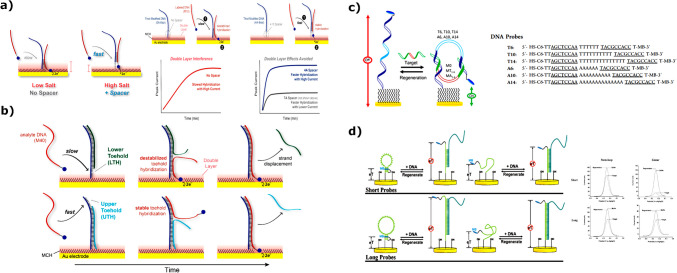
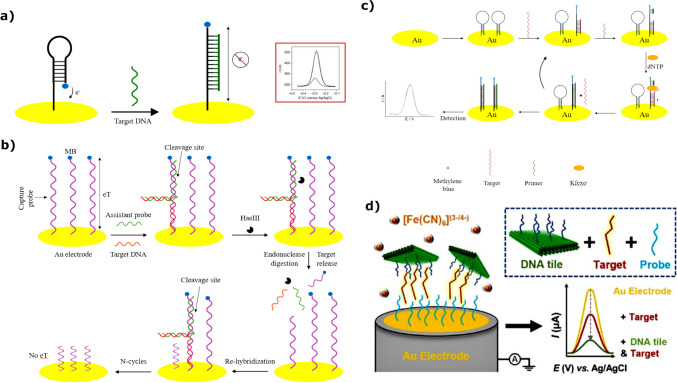
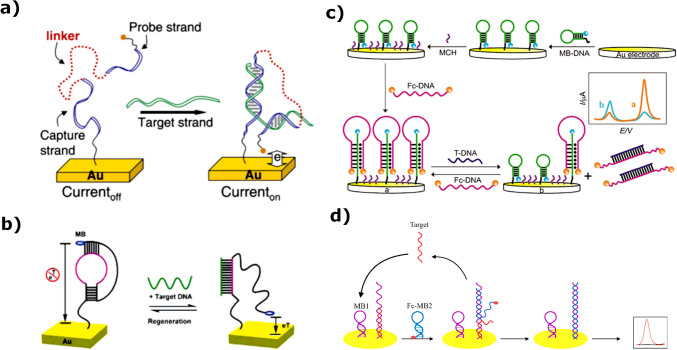
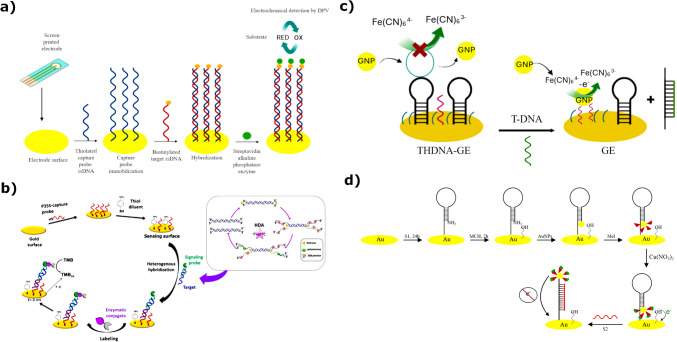
The uncontrolled distribution of genetically modified organisms (GMO)-based food and feed is an increasing global concern, primarily due to limited information about their potential harmful effects. The growing diversity and complexity of GMOs present significant challenges for their detection, traceability, and safety monitoring. Traditionally, GMOs are detected using molecular methods, among which PCR methods are the most explored and are considered the gold standard. However, isothermal nucleic acid amplification methods, though less explored, hold great potential, especially when integrated with biosensor platforms, enabling the development of highly efficient and versatile biosensing systems. This paper provides a comprehensive overview of the recent advances in biosensors utilizing methods of isothermal nucleic acid amplification, highlighting their current progress and future perspectives. We discuss molecular methods for GMO detection, focusing on reaction conditions, amplification efficiency, and compatibility with various detection modalities. Additionally, we investigate the integration of various nanomaterials into transducers, such as electrochemical platforms, together with the electrochemical techniques and detection mechanisms, aiming to outline their synergistic effects with molecular techniques to improve detection sensitivity and enable real-time monitoring. Furthermore, we discuss the applications of GMO biosensors across diverse fields, including food safety and environmental monitoring, while addressing existing challenges and potential strategies for improving the performance, robustness, and practicality of biosensing platforms. Overall, this review highlights the significant progress achieved in GMO biosensors and underscores their promising role in advancing diagnostic and monitoring capabilities.

Keywords: Electrochemical biosensors; Environmental monitoring; Field-effect transistor biosensors; Food safety; GMO; Nucleic acid amplification; Point-of-need; Transducers.


Conflict of interest statement

Declarations. Conflict of interest: The authors have no conflicts of interest to declare that are relevant to the content of this article. Clinical trial number: Not applicable.

Figures

Fig. 1
Fig. 1
Integration of a genetic construct into a plant genome for the expression of desired traits
Fig. 2
Fig. 2
Frame diagram representing a workflow of the review paper
Fig. 3
Fig. 3
Water-soluble cationic conjugated polymers (CCPs) have a delocalized π-conjugated backbone that transfers excitation energy to an acceptor fluorophore via fluorescence resonance energy transfer (FRET), amplifying the fluorescence signal by about ten times. Sybr Green I (SG), a dsDNA-specific dye, also acts as an energy acceptor for efficient FRET with CCPs as the donor. This enables easy visual detection of GM crops, making CCPs ideal for field testing and screening. Reprinted and modified from [42], with permission from Elsevier B.V. Copyright © 2024
Fig. 4
Fig. 4
DNA probe immobilization strategies: a Covalent immobilization of amine-terminated DNA probes on electrodes with various functional groups; b avidin/streptavidin-functionalized electrodes through carboxyl groups; c biotin/avidin (streptavidin)/biotin sandwiches technique. Reprinted and modified from [175]. Licensed under Creative Commons Attribution (CC BY-NC-ND 4.0), Copyright © 2017 The Authors. Published by Elsevier B.V
Fig. 5
Fig. 5
Schemes of each EBA molecule example: a 6-mercapto-1-hexanol (MCH); b 2-mercaptoethanol (MCE); c cysteamine hydrochloride (CHC); d sodium diethyldithiocarbamate (DEDTC); e 2-phenylethanethiol (2-PhET); f 1,3-benzenedithiol (BDT). Reprinted and modified from [201], with permission from Elsevier B.V. Copyright © 2022
Fig. 6
Fig. 6
Three DNA sensing platform approaches: A traditional backfilling; B insertion; C covalent DNA binding to a pure SAM. Reprinted and modified from [202], with permission from Elsevier B.V. Copyright © 2017
Fig. 7
Fig. 7
Interrogation of DNA-based biosensors via pulsed-voltage methods: A In DPV, a voltage pulse of a certain width and amplitude is applied to the electrode. The current is measured immediately before and at the end of the pulse, and the difference between the two currents is used to create a voltammogram; B IN SWV, a square waveform is superimposed on a voltage staircase. The current is measured at the end of each square pulse, producing forward (If) and reverse currents (Ir). The absolute values of both currents are subtracted to obtain a differential voltammogram; C in ACV, a sinusoidal waveform is superimposed on a linear ramp, and the current is measured at a regular frequency. The reference parameter values shown in panels A-C were estimated from reported DNA-based biosensors. Reprinted and modified from [211]. Licensed under Creative Commons Attribution License (CC BY 4.0) Copyright © 2019, The Authors. Published by ECS
Fig. 8
Fig. 8
Interrogation of DNA-based biosensors via electrochemical impedance spectroscopy: A A sinusoidal voltage is applied (solid line) at a fixed frequency, generating the corresponding current (dashed line). This is repeated for a wide range of frequencies; B the imaginary part of the impedance is plotted against the real part for each sampled frequency to obtain the Nyquist plot. The value of the impedance and its phase angle at a certain frequency can be obtained from the module and the angle of the vector, respectively; C-D bode plots provide another way of representing the data obtained in an EIS measurement. In this case, the impedance and the phase angle are plotted against the applied frequency, offering a straightforward manner to view the impedance at a certain frequency value; B-D spectra obtained for a non-faradaic (dashed line) and a faradaic (solid line) system. Reprinted from [211]. Licensed under Creative Commons Attribution License (CC BY 4.0) Copyright © 2019, The Authors. Published by ECS
Fig. 9
Fig. 9
Schematic depiction of redox-active molecule interactions with DNA molecules. Reprinted and modified from [175]. Licensed under Creative Commons Attribution License (CC BY-NC-ND 4.0). Copyright © 2017, The Authors. Published by Elsevier B.V
Fig. 10
Fig. 10
a Schematics illustrating various binding states of ssDNA probes on a gold surface (i), representation of a MCH monolayer that inhibits direct interactions between the DNA backbone and the substrate (ii). Reprinted and modified from [226]. Licensed under Creative Commons Attribution License (CC BY-NC-ND 4.0). Copyright © 2018, The Authors. Published by De Gruyter Open Access. b Gold electrode-bound hairpin-structured DNA probe: target hybridization displaces the ferrocene label, altering the redox current. Reprinted and modified with permission from [230]. Copyright © 2003, The National Academy of Sciences. c Comparison of linear vs. stem–loop (hairpin) E-DNA biosensor. Reprinted and modified with permission from [231]. Copyright © 2011, American Chemical Society. d Schematic illustration of 3D DNA probe architectures for an electrochemical DNA (E-DNA) sensor: tetrahedral DNA probe A. Reprinted and modified from [226]. Licensed under Creative Commons Attribution License (CC BY-NC-ND 4.0). Copyright © 2018, The Authors. Published by De Gruyter Open Access
Fig. 11
Fig. 11
a Schematic diagram demonstrating how the density of DNA probes attached to an electrode impacts electrochemical detection: (i) high density, (ii) low density. Reprinted and modified with permission from [234]. Copyright © 2007, American Chemical Society. b Schematic representation of (i) A DNA-modified electrode with methylene blue as a redox molecule illustrating DNA-mediated and direct reduction pathways, (ii) the effect of a single base mismatch on the electrochemical signal. Reprinted and modified with permission from [235]. Copyright © 2012, American Chemical Society. c Schematic representation of (i) a well-formed and poorly formed DNA duplex monolayer, (ii) well-assembled DNA duplexes mediated charge transfer via redox-active probes, with a single CA mismatch significantly reducing the MB signal, in contrast to non-specific electron transfer in disordered monolayers. Reprinted and modified with permission from [236]. Licensed under Creative Commons Attribution License (CC BY-NC-ND 4.0). Copyright © 2021, The Authors. Published by American Chemical Society
Fig. 12
Fig. 12
a Schematic illustration of the Influence of redox molecule placement on electrochemical detection. Reprinted and modified with permission from [237]. Copyright © 2018 Wiley–VCH Verlag GmbH & Co. KGaA, Weinheim. b Schematic illustration of dual-signaling DNA biosensor: redox markers at the distal end yield higher currents than proximal markers due to enhanced ion accessibility. Reprinted and modified with permission from [238]. Copyright © 2018, American Chemical Society
Fig. 13
Fig. 13
a Schematic illustration of the influence of ionic strength and nucleotide spacer on electrochemical DNA detection. Reprinted and modified with permission from [240]. Copyright © 2023, American Chemical Society. b Schematic illustration showing how the toehold position impacts electrochemical DNA detection. Reprinted and modified with permission from [240]. Copyright © 2023, American Chemical Society. c Schematic design and signaling mechanism of an E-DNA sensor, emphasizing the critical role of internal spacers. Reprinted and modified with permission from [242]. Copyright © 2014, American Chemical Society. d Schematic comparison of E-DNA biosensors: linear biosensors with longer probes (proximal redox tag) boost signal intensity at the expense of specificity, while stem-loop biosensors exhibit smaller signal changes, offering improved sequence discrimination. Reprinted and modified with permission from [243]. Copyright © 2009, American Chemical Society
Fig. 14
Fig. 14
a Schematic representation of a typical thiolated, MB-modified DNA probe used in constructing an E-DNA sensor. Reprinted and modified from [244], with permission from Springer Nature. Copyright © 2007. b Schematic of an electrochemical DNA biosensor employing a “Y” junction design combined with a restriction endonuclease-mediated target recycling strategy. Reprinted and modified from [245], with permission from the Royal Society of Chemistry. Copyright © 2012. c Schematic illustration of the electrochemical DNA biosensor based on circular strand-replacement polymerization (CSRP). Reprinted and modified from [246], with permission from Elsevier B.V. Copyright © 2015. d Schematic of an electrochemical DNA biosensor using a DNA origami sandwich assay. Reprinted and modified with permission from [247]. Licensed under Creative Commons Attribution License (CC BY 4.0). Copyright © 2023, The Authors. Published by American Chemical Society
Fig. 15
Fig. 15
a Schematic representation of electrochemical nucleic acid detection using a DNA wrap assay. Reprinted and modified with permission from [248]. Copyright © 2004, American Chemical Society. b Schematic illustration of a signal-on E-DNA sensor based on target-induced unfolding of an electrode-bound, MB-modified DNA pseudoknot. Reprinted and modified with permission from [233]. Copyright © 2007, American Chemical Society. c Schematic diagram of triple-helix molecular switch electrochemical DNA biosensor that uses target-induced disassembly to decrease the ferrocene signal and increase the MB signal. Reprinted and modified with permission from [250]. Copyright © 2017, American Chemical Society. d Schematic depiction of an E-DNA sensor employing a target-catalyzed hairpin assembly strategy. Reprinted and modified from [251], with permission from Elsevier B.V. Copyright © 2015
Fig. 16
Fig. 16
a Schematic of an enzyme-amplified electrochemical DNA biosensor featuring a gold electrode, target hybridization, enzymatic labeling and detection. Reprinted and modified from [252], with permission from Elsevier B.V. Copyright © 2018. b Schematic representation of a label-free electrochemical DNA biosensor on a gold film electrode using a sandwich hybridization assay, peroxidase labeling, and CA detection after TMB oxidation. Reprinted and modified with permission from [49]. Copyright © 2015, American Chemical Society. c Schematic of a label-free E-DNA biosensor where target hybridization frees the capture probe for gold nanoparticle binding, enhancing electron transfer. Reprinted and modified from [254], with permission from Elsevier B.V. Copyright © 2021. d Schematic illustration of the fabrication process for a DNA biosensor employing in-situ assembled AuNPs-Mel-Cu2⁺ as the signal tag. Reprinted and modified from [255]. Licensed under Creative Commons Attribution License (CC BY 4.0). Copyright © 2016, The Authors. Published by Springer Nature
Fig. 17
Fig. 17
Schematic representation of a 2D-FET operation principles. a Two operational configurations—back-gate (solid gate) and top-gate (liquid gate) used in (bio)sensing. b Signal development in 2D-FET biosensors: Dirac point shift in ambipolar channel materials (top left) or threshold voltage shift in semiconductor channels (down left), change in drain current at fixed gate voltage (top middle) and respective time-dependent change of ID due to transfer curve shift (down middle), transconductance change of a transfer curve (change in slope of the linear part) (top right), and respective time-dependent change of ID due to transfer curve slope change (down right). c Four types of sensing mechanisms in 2D-FETs: electrostatic gating effect between ssDNA probe and graphene channel inducing p-type doping (top left), charge transfer effect between adsorbed ssDNA on graphene channel inducing n-type doping (top right), Donnan potential effect explained by the semi-permeable layer formed by a polymer that adds a Donnan capacitance (CDonn) to the total capacitance (down left), and charge scattering effect induced by the DNA probe, which reduces carrier mobility and consequently transconductance (down right). d Schematic description of the screening effect in liquid-gated FET using PBS as an electrolyte example
Fig. 18
Fig. 18
a Detection of lambda phage genomic DNA LAMP reaction using chamber-supported GFET biosensor; the release of protons enables doping of graphene channel, and DP shift is recorded every 5 min, enabling detection of only 2 × 102 copies/μL of viral DNA. Reprinted and modified from [282], with permission from Elsevier B.V. Copyright © 2017. b POC device in the form of a crumpled graphene FET for the detection of SARS-CoV-2 DNA amplified by RT-LAMP using primer consumption strategy; crumpled graphene ensures higher DP shift upon ssDNA adsorption, with higher shift for no SARS-CoV-2 DNA (negative samples) and shift decrease for increased virus presence in positive patients. Reprinted and modified with permission from [284]. Copyright © 2021, American Chemical Society. c Innovative functionalization of graphene utilizing tetrahedral dsDNA structure with ssDNA (H1) probe for highly sensitive miRNA-21 detection; CHA is applied to amplify the signal from target RNA reaching an LOD of 5.67 × 10−19 M in buffer, while GFET biosensor was able to detect target RNA in different cell lines in complex medium. Reprinted and modified with permission from [273]. Copyright © 2023, American Chemical Society
Fig. 19
Fig. 19
a Development of a POC device based on GFET biosensor for the ultrasensitive detection of S. Aureus DNA; gold gate electrode was functionalized with specific ssDNA probe and blocked by MCH to enable a broad range of detected DNA from 10−16 to 10−8 M using real-time measurements; they integrated the POC device with a smartphone using portable reader to showcase in-field possibilities of their biosensor. Reprinted and modified from [287], with permission from Elsevier B.V. Copyright © 2024. b Groundbreaking detection of DNA using crumpled GFET device with zeptomolar detection limit; they studied two types of probes, DNA and PNA, to reach LOD of 600 zM in 1 × PBS, owing to the crumpled morphology of graphene surface altering EDL structure. Reprinted and modified from Hwang et al. [279]. Licensed under Creative Commons Attribution License (CC BY). Copyright © 2020, Hwang et al. c An extended-gate FET POC device for the detection of E. coli O157:H7 DNA sequences using portable MOSFET configuration; they adopted DNA fragmentation by sonication to prove detection of the specific intimin gene in human serum samples with performances that are comparable to test laboratory samples. Reprinted and modified with permission from Paulose et al. [289]. Copyright © 2023, American Chemical Society. d Integration of CRISPR/Cas12a system with GFET for HPV-16 and E. coli detection; upon binding of the target, Cas12a cleaves the bystanding polyA or polyC probes on graphene, inducing DP shift, the GFET-CRISPR chip was able to recognize ssDNA from HPV-16 and dsDNA from E. coli with LODs of 1 and 10 aM, respectively. Reprinted and modified with permission from Weng et al. [277]. Copyright © 2023, American Chemical Society

Similar articles

References

    1. Peter R, Mojca J, Primož P (2011) Genetically modified organisms (GMOs). In: Encyclopedia of Environmental Health. pp. 879–888. Elsevier
    1. Eriksson D (2019) The evolving EU regulatory framework for precision breeding. Theor Appl Genet 132:569–573. 10.1007/s00122-018-3200-9 - PMC - PubMed
    1. Uslu T (2021) Advantages, risks and legal perspectives of GMOs in 2020s. Plant Biotechnol Rep 15:741–751. 10.1007/s11816-021-00714-0
    1. Zilberman D, Holland TG, Trilnick I (2018) Agricultural GMOs—what we know and where scientists disagree. Sustainability 10:1514. 10.3390/su10051514
    1. Teferra TF (2021) Should we still worry about the safety of GMO foods? Why and why not? A review Food Sci Nutr 9:5324–5331. 10.1002/fsn3.2499 - PMC - PubMed

MeSH terms

LinkOut - more resources