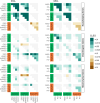
Bath: a Bayesian approach to analyze epigenetic transitions reveals a dual role of H3K27me3 in chondrogenesis
- PMID: 40571950
- PMCID: PMC12203727
- DOI: 10.1186/s13072-025-00594-6
Bath: a Bayesian approach to analyze epigenetic transitions reveals a dual role of H3K27me3 in chondrogenesis
Abstract
Background: Histone modifications are key epigenetic regulators of cell differentiation and have been intensively studied in many cell types and tissues. Nevertheless, we still lack a thorough understanding of how combinations of histone marks at the same genomic location, so-called chromatin states, are linked to gene expression, and how these states change in the process of differentiation. To receive insight into the epigenetic changes accompanying the differentiation along the chondrogenic lineage we analyzed two publicly available datasets representing (1) the early differentiation stages from embryonic stem cells into chondrogenic cells and (2) the direct differentiation of mature chondrocyte subtypes.
Results: We used ChromHMM to define chromatin states of 6 activating and repressive histone marks for each dataset and tracked the transitions between states that are associated with the progression of differentiation. As differentiation-associated state transitions are likely limited to a reduced set of genes, one challenge of such global analyses is the identification of these rare transitions within the large-scale data. To overcome this problem, we have developed a relativistic approach that quantitatively relates transitions of chromatin states on defined groups of tissue-specific genes to the background. In the early lineage, we found an increased transition rate into activating chromatin states on mesenchymal and chondrogenic genes while mature chondrocytes are mainly enriched in transition between activating states. Interestingly, we also detected a complex extension of the classical bivalent state (H3K4me3/H3K27me3) consisting of several activating promoter marks besides the repressive mark H3K27me3. Within the early lineage, mesenchymal and chondrogenic genes undergo transitions from this state into active promoter states, indicating that the initiation of gene expression utilizes this complex combination of activating and repressive marks. In contrast, at mature differentiation stages the inverse transition, the gain of H3K27me3 on active promoters, seems to be a critical parameter linked to the initiation of gene repression in the course of differentiation.
Conclusions: Our results emphasize the importance of a relative analysis of complex epigenetic data to identify chromatin state transitions associated with cell lineage progression. They further underline the importance of serial analysis of such transitions to uncover the diverse regulatory potential of distinct histone modifications like H3K27me3.
Keywords: Chondrocyte differentiation; Chromatin states; Epigenetic regulation; Histone modification.
© 2025. The Author(s).
Conflict of interest statement
Declarations. Ethics approval and consent to participate: Not applicable. Consent for publication: Not applicable. Competing interests: The authors declare no Competing interests.
Figures


Similar articles
-
Bivalent Histone Modifications and Development.Curr Stem Cell Res Ther. 2018;13(2):83-90. doi: 10.2174/1574888X12666170123144743. Curr Stem Cell Res Ther. 2018. PMID: 28117006
-
[Epigenetics' implication in autism spectrum disorders: A review].Encephale. 2017 Aug;43(4):374-381. doi: 10.1016/j.encep.2016.07.007. Epub 2016 Sep 28. Encephale. 2017. PMID: 27692350 French.
-
Signs and symptoms to determine if a patient presenting in primary care or hospital outpatient settings has COVID-19.Cochrane Database Syst Rev. 2022 May 20;5(5):CD013665. doi: 10.1002/14651858.CD013665.pub3. Cochrane Database Syst Rev. 2022. PMID: 35593186 Free PMC article.
-
A rapid and systematic review of the clinical effectiveness and cost-effectiveness of paclitaxel, docetaxel, gemcitabine and vinorelbine in non-small-cell lung cancer.Health Technol Assess. 2001;5(32):1-195. doi: 10.3310/hta5320. Health Technol Assess. 2001. PMID: 12065068
-
Drugs for preventing postoperative nausea and vomiting in adults after general anaesthesia: a network meta-analysis.Cochrane Database Syst Rev. 2020 Oct 19;10(10):CD012859. doi: 10.1002/14651858.CD012859.pub2. Cochrane Database Syst Rev. 2020. PMID: 33075160 Free PMC article.
References
-
- (2020) Anaconda software distribution. https://docs.anaconda.com/
-
- Andrews S. Fastqc. a quality control tool for high throughput sequence data. http://www.bioinformatics.babraham.ac.uk/projects/fastqc 2010
-
- Azuara V, Perry P, Sauer S, et al. Chromatin signatures of pluripotent cell lines. Nat Cell Biol. 2006;8(5):532–8. 10.1038/ncb1403. - PubMed
-
- Barski A, Cuddapah S, Cui K, et al. High-resolution profiling of histone methylations in the human genome. Cell. 2007;129(4):823–37. 10.1016/j.cell.2007.05.009. - PubMed
MeSH terms
Substances
Grants and funding
LinkOut - more resources
Full Text Sources
Research Materials

