

Phosphatidylethanol in post-mortem blood: A comparative study of blood matrices and its stability at routine storage conditions
- PMID: 40572016
- PMCID: PMC12424113
- DOI: 10.1111/1556-4029.70106
Phosphatidylethanol in post-mortem blood: A comparative study of blood matrices and its stability at routine storage conditions
Abstract
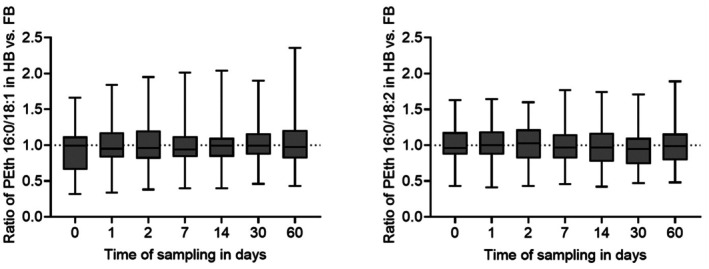
Determination of alcohol markers in post-mortem cases can be useful to classify drinking habits and potential alcohol habituation prior to death. Phosphatidylethanol (PEth) is a direct alcohol marker and is already commonly used in a variety of contexts. However, its use in the field of post-mortem toxicology has been scarcely investigated so far. To evaluate its validity, PEth was determined in routinely collected post-mortem heart blood and femoral vein blood. The stability of PEth under routine storage conditions (-20°C) for a period of 60 days was examined. Post-mortem blood was collected during medicolegal autopsies and aliquoted. Parts of the samples were used to create dried blood spots (DBS) directly after collection. Further DBS were created using aliquots stored at -20°C on days 1, 2, 7, 14, 30, and 60. LC-MS/MS was used for quantitative PEth analysis, and initial blood alcohol was determined using GC-FID. Blood was collected from 50 different post-mortem cases. The heart blood/femoral blood ratio of PEth concentrations varied from 0.32 to 2.36 (mean = approx. 1.00), indicating a good comparability in total but a strong interindividual variation. In all PEth-positive samples, the PEth concentrations increased by approximately 20% after 24 hours and 70% after 60 days. Post-sampling formation of PEth was also found in blood samples without detectable amounts of ethanol. Neither storage at -80°C nor the addition of sodium metavanadate led to satisfactory stability of PEth. Based on our findings, the (sole) use of PEth for post-mortem toxicology caseworks is not recommended.
Keywords: alcohol biomarker; dried blood spots; femoral vein blood; forensic toxicology; heart blood; phospholipase D.
© 2025 The Author(s). Journal of Forensic Sciences published by Wiley Periodicals LLC on behalf of American Academy of Forensic Sciences.
Conflict of interest statement
The authors have no conflicts to declare.
Figures


Similar articles
-
Assessment and cross-validation of calibration transferability between dried blood spot sampling devices for accurate quantification of phosphatidylethanol.Anal Bioanal Chem. 2025 Jul;417(17):3803-3811. doi: 10.1007/s00216-025-05897-x. Epub 2025 May 15. Anal Bioanal Chem. 2025. PMID: 40372410 Free PMC article.
-
Validation of the quantification of phosphatidylethanol 16:0/18:1 concentrations in TASSO-M20 devices.Alcohol Clin Exp Res (Hoboken). 2023 Apr;47(4):748-755. doi: 10.1111/acer.15024. Epub 2023 Feb 21. Alcohol Clin Exp Res (Hoboken). 2023. PMID: 36811188 Free PMC article.
-
Hair EtG Testing in Combination With Measurements of PEth and EtG in Blood to Improve the Assessment of Alcohol Consumption.Drug Test Anal. 2025 Sep;17(9):1588-1593. doi: 10.1002/dta.3865. Epub 2025 Feb 6. Drug Test Anal. 2025. PMID: 39911066
-
Phosphatidylethanol (PEth) in Blood as a Marker of Unhealthy Alcohol Use: A Systematic Review with Novel Molecular Insights.Int J Mol Sci. 2023 Jul 29;24(15):12175. doi: 10.3390/ijms241512175. Int J Mol Sci. 2023. PMID: 37569551 Free PMC article.
-
Signs and symptoms to determine if a patient presenting in primary care or hospital outpatient settings has COVID-19.Cochrane Database Syst Rev. 2022 May 20;5(5):CD013665. doi: 10.1002/14651858.CD013665.pub3. Cochrane Database Syst Rev. 2022. PMID: 35593186 Free PMC article.
References
Publication types
MeSH terms
Substances
LinkOut - more resources
Full Text Sources
Miscellaneous
