

Membrane Vesicles of Enterococcus faecalis: In Vitro Composition Analysis and Macrophage Inflammatory Response Under Different pH Conditions
- PMID: 40572231
- PMCID: PMC12195402
- DOI: 10.3390/microorganisms13061344
Membrane Vesicles of Enterococcus faecalis: In Vitro Composition Analysis and Macrophage Inflammatory Response Under Different pH Conditions
Abstract
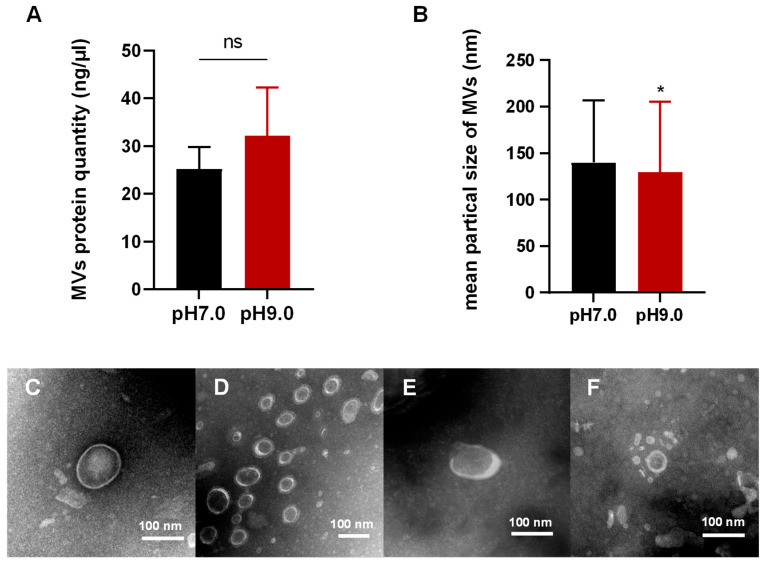
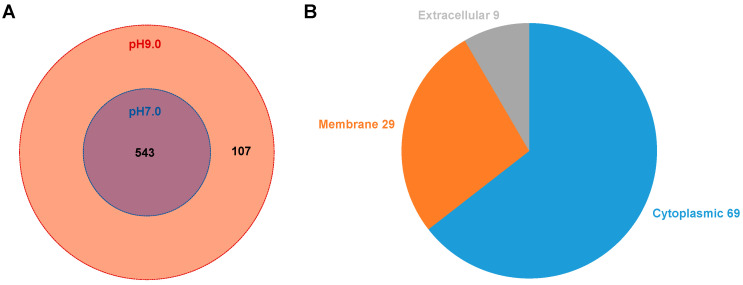
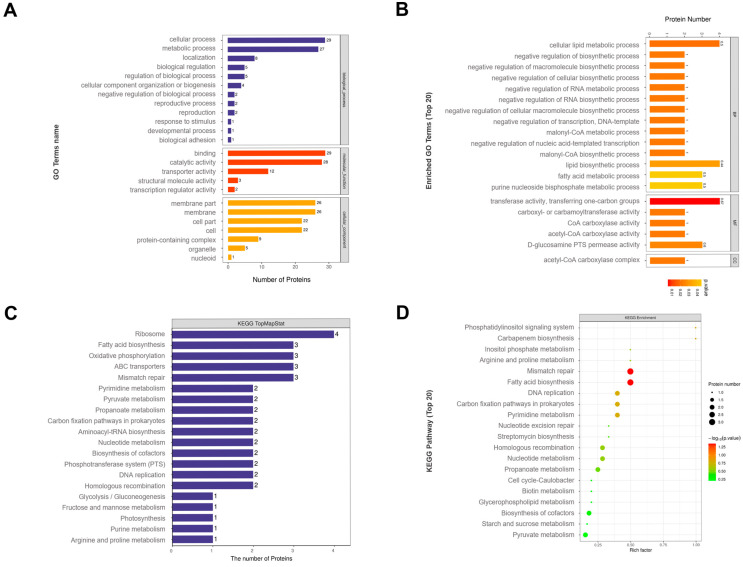
Enterococcus faecalis (E. faecalis) is one of the most detected bacteria in persistent apical periodontitis (PAP), with alkaline tolerance enabling post-treatment survival. In this study, we will investigate how alkaline conditions alter proteomic and metabolomic profiles of E. faecalis membrane vesicles (MVs) and preliminarily investigate the role of MVs of E. faecalis in the regulation of macrophage inflammatory response. E. faecalis MVs were characterized using transmission electron microscopy and nanoparticle tracking analysis under varying pH conditions. MVs' proteomic and metabolomic profiling across pH levels was compared. The effects of E. faecalis MVs on human dTHP-1 macrophages were evaluated using CCK-8 metabolic activity assays and ELISA-based quantitative analysis of inflammatory cytokines. In this study, the presence of E. faecalis MVs was verified, and the alkaline environment of pH 9.0 did not alter their production. Through proteomic and metabolomic analysis, we observed that ATP synthase and stress proteins, as well as lysine degradation and tryptophan metabolism pathways, were significantly enriched in the MVs at pH 9.0. Finally, we observed that both E. faecalis MVs at pH 7.0 and pH 9.0 could dose-dependently inhibit the activity of dTHP-1 cells. E. faecalis MVs promote the secretion of IL-6, TNF-α, IL-1β, IL-1ra, and TGF-β by macrophages. Compared to pH 7.0, pH 9.0 E. faecalis MVs have a reduced effect on IL-1ra and TGF-β secretion. Additionally, we observed a significant increase in the IL-1β/IL-1ra ratio after treatment with E. faecalis MVs. Our study indicated that E. faecalis can produce MVs in pH 7.0 and pH 9.0 environments. ATP synthase, stress proteins, as well as lysine degradation and tryptophan metabolism pathways, were significantly enriched in pH 9.0 MVs. Furthermore, E. faecalis MVs could promote inflammatory responses in macrophages and dose-dependently inhibit the viability of dTHP-1 cells.
Keywords: Enterococcus faecalis; immuno-inflammatory responses; macrophages; membrane vesicles; metabolomics; proteomics.
Conflict of interest statement
The authors declare no competing interest.
Figures


Similar articles
-
Systemic pharmacological treatments for chronic plaque psoriasis: a network meta-analysis.Cochrane Database Syst Rev. 2021 Apr 19;4(4):CD011535. doi: 10.1002/14651858.CD011535.pub4. Cochrane Database Syst Rev. 2021. Update in: Cochrane Database Syst Rev. 2022 May 23;5:CD011535. doi: 10.1002/14651858.CD011535.pub5. PMID: 33871055 Free PMC article. Updated.
-
Signs and symptoms to determine if a patient presenting in primary care or hospital outpatient settings has COVID-19.Cochrane Database Syst Rev. 2022 May 20;5(5):CD013665. doi: 10.1002/14651858.CD013665.pub3. Cochrane Database Syst Rev. 2022. PMID: 35593186 Free PMC article.
-
Systemic pharmacological treatments for chronic plaque psoriasis: a network meta-analysis.Cochrane Database Syst Rev. 2017 Dec 22;12(12):CD011535. doi: 10.1002/14651858.CD011535.pub2. Cochrane Database Syst Rev. 2017. Update in: Cochrane Database Syst Rev. 2020 Jan 9;1:CD011535. doi: 10.1002/14651858.CD011535.pub3. PMID: 29271481 Free PMC article. Updated.
-
How lived experiences of illness trajectories, burdens of treatment, and social inequalities shape service user and caregiver participation in health and social care: a theory-informed qualitative evidence synthesis.Health Soc Care Deliv Res. 2025 Jun;13(24):1-120. doi: 10.3310/HGTQ8159. Health Soc Care Deliv Res. 2025. PMID: 40548558
-
Antiretrovirals for reducing the risk of mother-to-child transmission of HIV infection.Cochrane Database Syst Rev. 2011 Jul 6;(7):CD003510. doi: 10.1002/14651858.CD003510.pub3. Cochrane Database Syst Rev. 2011. PMID: 21735394
References
-
- Qian Y., Wu J., Yang W., Lyu R., You Q., Li J., He Q., Zhuang Y., Wang W., Wang Y., et al. FTO-associated osteoclastogenesis promotes alveolar bone resorption in apical periodontitis male rat via the HK1/USP14/RANK pathway. Nat. Commun. 2025;16:1519. doi: 10.1038/s41467-025-56615-1. - DOI - PMC - PubMed
-
- Park D.H., Tak E.J., Park O.J., Perinpanayagam H., Yoo Y.J., Lee H.J., Jeong Y.S., Lee J.Y., Kim H.S., Bae J.W., et al. Association between root canals and gingival sulci microbiota in secondary and persistent endodontic infections. Sci. Rep. 2025;15:11253. doi: 10.1038/s41598-025-95522-9. - DOI - PMC - PubMed
Grants and funding
LinkOut - more resources
Full Text Sources
Research Materials
