. 2025 Jun 16;13(6):1400.
doi: 10.3390/microorganisms13061400.

Impact of c-di-AMP Accumulation, L-cysteine, and Oxygen on Catalase Activity and Oxidative Stress Resistance of Listeria monocytogenes 10403S

Affiliations

Impact of c-di-AMP Accumulation, L-cysteine, and Oxygen on Catalase Activity and Oxidative Stress Resistance of Listeria monocytogenes 10403S

Mahide Muge Yilmaz Topcam et al. Microorganisms. .

Abstract

Listeria monocytogenes is a foodborne pathogen frequently exposed to oxidative stress in diverse environmental conditions. Cyclic di-AMP (c-di-AMP) is a second messenger that plays a key role in stress resistance. This study investigates the role of pdeA (degrades c-di-AMP) and how c-di-AMP accumulation affects catalase activity and oxidative stress response and gene expression. Survival and catalase activity assays were conducted under oxidative stress, and c-di-AMP levels were quantified in L. monocytogenes 10403S under aerobic, anaerobic, and L-cysteine-supplemented conditions. ΔpdeA, which accumulates c-di-AMP, exhibited greater sensitivity to oxidative stress (4.6 log reduction for the wild type (WT) vs 7.34 log reduction for ΔpdeA at 10 h) and lower catalase activity than the WT in the early stationary phase. However, in the late stationary phase, while the catalase activity levels of ΔpdeA remained stable (~6.33 cm foam height), it became resistant to oxidative stress (5.85 log reduction). These findings indicate that pdeA contributes to catalase activity in L. monocytogenes. Transcriptomic analysis revealed differential expression of pathways mainly including pentose phosphate pathway, carbon metabolism, O-antigen nucleotide sugar biosynthesis and ABC transporters in ΔpdeA compared to WT. Our transcriptomic data provided promising insights into the molecular mechanisms underlying c-di-AMP regulation, which may enhance stress resistance. Moreover, oxidative stress led to increased intracellular c-di-AMP levels. Under L-cysteine supplementation, catalase activity levels in WT were similar to ΔpdeA (~1.86 cm foam height for both), but the latter showed enhanced oxidative stress resistance and c-di-AMP levels. Anaerobic conditions also elevated c-di-AMP levels in WT and ΔpdeA but resulted in greater oxidative stress sensitivity. Understanding these regulatory mechanisms provides valuable insights into oxidative stress resistance, with potential implications for food safety and pathogen control.

Keywords: Listeria monocytogenes; c-di-AMP accumulation; catalase activity; cysteine; oxidative stress resistance; phosphodiesterase; second messenger.


Conflict of interest statement

The authors declare no conflicts of interest.

Figures

Figure 1
Figure 1
10403S WT (grey line with grey round markers) and ΔpdeA (grey line with white round markers) growth profiles at 37 °C under aerobic conditions with optical density was measured at 620 nm (OD620) every 2 h (A). Catalase activity of 10403S WT (black line with black triangle markers) and ΔpdeA cells (black line with white triangle markers) was measured every 2 h as cm of foam following catalase reaction, with photos taken (photos represent one of the replicates) (A). At the maximum catalase levels of WT cells (10 and 18 h), intracellular c-di-AMP concentrations of both WT (black bars) and ΔpdeA cells (white bars) were measured in triplicate (B). Error bars represent standard deviation, and asterisks show statistically significant differences in the catalase activity and c-di-AMP levels of WT and ΔpdeA (p < 0.05).
Figure 2
Figure 2
Survival and catalase activity of WT (black round markers and black bars, respectively) and ΔpdeA (white round markers and white bars, respectively) cultures grown for 10 h (A) and 18 h (B) following the addition of H2O2 to a final concentration of 5.25%. All the experiments were performed in three biological replicates. Error bars represent standard deviation, while asterisks denote statistically significant differences between the WT and ΔpdeA (p < 0.05).
Figure 3
Figure 3
Intracellular c-di-AMP concentrations of 10hgrown WT and ΔpdeA cells prior to H2O2 stress (white bars), right after the H2O2 treatment (0 min; black bars) and after 60 min (1h; patterned bars). The average accumulation of the cells during the oxidative shock was measured from triplicate experiments. Error bars represent the standard deviation of three experiments. Lowercase letters indicate the difference between WT cells, while uppercase letters indicate the difference between ΔpdeA cells in BHI. Asterisks show significant differences between the strains (p < 0.05).
Figure 4
Figure 4
Volcano plot showing differential gene expression between ΔpdeA (treatment) and WT (control) strains grown for 10 h under aerobic conditions. In the volcano plot, the x-axis represents the log2-fold change in gene expression, while the y-axis represents the negative logarithm of the p-value (−log(p-value)), highlighting statistical significance. Genes with a log2-fold change greater than 0 and p-value < 0.05 are considered upregulated (coloured in red), while genes with a log2-fold change less than 0 are downregulated (coloured in green). Genes with no significant change are coloured in blue. The plot visually identifies differentially expressed genes between the two conditions.
Figure 5
Figure 5
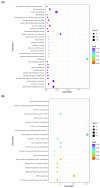
Gene ontology (GO) analysis with the most significant enrichment (A) and the most abundant pathways (KEGG); upregulated (B) and downregulated (C) of differentially expressed genes (DEGs) in ΔpdeA (treatment) and WT (control) strains grown for 10 h under aerobic conditions. The size of the dots is proportional to the number of genes; the closer the q value is to 0, the greater the extent of enrichment (* GO:0016747; ** KEGGID:lmt00130). KEGG pathway enrichment analysis identified several significantly enriched pathways among the differentially expressed genes (padj > 0.05; (B,C)). The most enriched pathways included “O-antigen nucleotide sugar biosynthesis” and “ABC transporters” with high gene ratios and low adjusted p-values. Other significantly enriched metabolic pathways included “glycerophospholipid metabolism”, “terpenoid backbone biosynthesis” and “biosynthesis of nucleotide sugar metabolism” (B). On the other hand, the downregulated gene set showed enrichment in core metabolic pathways, including “pentose phosphate pathway (PPP)” (padj < 0.05), “carbon metabolism” (padj < 0.05), “microbial metabolism in diverse environments”, “pyruvate metabolism” “sulfur relay system” and “citrate cycle (TCA cycle; Tricarboxylic Acid Cycle)”, with high gene ratios and strong statistical significance (padj < 0.5; (C)).
Figure 5
Figure 5
Gene ontology (GO) analysis with the most significant enrichment (A) and the most abundant pathways (KEGG); upregulated (B) and downregulated (C) of differentially expressed genes (DEGs) in ΔpdeA (treatment) and WT (control) strains grown for 10 h under aerobic conditions. The size of the dots is proportional to the number of genes; the closer the q value is to 0, the greater the extent of enrichment (* GO:0016747; ** KEGGID:lmt00130). KEGG pathway enrichment analysis identified several significantly enriched pathways among the differentially expressed genes (padj > 0.05; (B,C)). The most enriched pathways included “O-antigen nucleotide sugar biosynthesis” and “ABC transporters” with high gene ratios and low adjusted p-values. Other significantly enriched metabolic pathways included “glycerophospholipid metabolism”, “terpenoid backbone biosynthesis” and “biosynthesis of nucleotide sugar metabolism” (B). On the other hand, the downregulated gene set showed enrichment in core metabolic pathways, including “pentose phosphate pathway (PPP)” (padj < 0.05), “carbon metabolism” (padj < 0.05), “microbial metabolism in diverse environments”, “pyruvate metabolism” “sulfur relay system” and “citrate cycle (TCA cycle; Tricarboxylic Acid Cycle)”, with high gene ratios and strong statistical significance (padj < 0.5; (C)).
Figure 6
Figure 6
Oxidative stress survival (A), catalase activity levels (B) and intracellular c-di-AMP levels per cell (C) of 18 h aerobically grown WT and ΔpdeA cells. 1.5% and 4.5% H2O2 were applied for survival experiments to the cells grown in DM and L–cysteine–supplemented DM, respectively. Black bars represent WT, while white bars represent ΔpdeA cells. All the experiments were performed in triplicate, and average measurements are presented. Error bars represent standard deviation. Uppercase letters indicate the difference between WT cells, while lowercase letters indicate the difference between ΔpdeA cells in various media. Asterisks demonstrate statistical differences between the strains (p < 0.05).
Figure 7
Figure 7
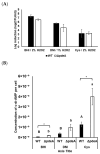
Survival of WT (black bars) and ΔpdeA (white bars) cultures grown until 18 h in BHI, DM and L-cysteine-supplemented DM under anaerobic conditions (A); and intracellular c-di-AMP levels of WT (black bars) and ΔpdeA (white bars) under the same growth conditions (B). 1% was used in DM, 2% was used for BHI and L-cysteine-supplemented DM. All the experiments were replicated three times, and average values are presented. Error bars represent standard deviation. Uppercase letters indicate the difference between WT cells, while lowercase letters indicate the difference between ΔpdeA cells in various media. Asterisks demonstrate statistical differences between the strains (p < 0.05).

Similar articles

References

    1. Lungu B., Ricke S.C., Johnson M.G. Growth, survival, proliferation and pathogenesis of Listeria monocytogenes under low oxygen or anaerobic conditions: A review. Anaerobe. 2009;15:7–17. doi: 10.1016/j.anaerobe.2008.08.001. - DOI - PubMed
    1. Pizarro-Cerdá J., Cossart P. Listeria monocytogenes: Cell biology of invasion and intracellular growth. Microbiol. Spectr. 2018;6 doi: 10.1128/microbiolspec.GPP3-0013-2018. - DOI - PMC - PubMed
    1. Matereke L.T., Okoh A.I. Listeria monocytogenes virulence, antimicrobial resistance and environmental persistence: A review. Pathogens. 2020;9:528. doi: 10.3390/pathogens9070528. - DOI - PMC - PubMed
    1. White S.J., McClung D.M., Wilson J.G., Roberts B.N., Donaldson J.R. Influence of pH on bile sensitivity amongst various strains of Listeria monocytogenes under aerobic and anaerobic conditions. J. Med. Microbiol. 2015;64:1287–1296. doi: 10.1099/jmm.0.000160. - DOI - PMC - PubMed
    1. Mongkolsuk S., Helmann J.D. Regulation of inducible peroxide stress responses. Mol. Microbiol. 2002;45:9–15. doi: 10.1046/j.1365-2958.2002.03015.x. - DOI - PubMed

LinkOut - more resources