

Understanding the Light-Driven Enhancement of CO2 Hydrogenation over Ru/TiO2 Catalysts
- PMID: 40572541
- PMCID: PMC12196449
- DOI: 10.3390/molecules30122577
Understanding the Light-Driven Enhancement of CO2 Hydrogenation over Ru/TiO2 Catalysts
Abstract
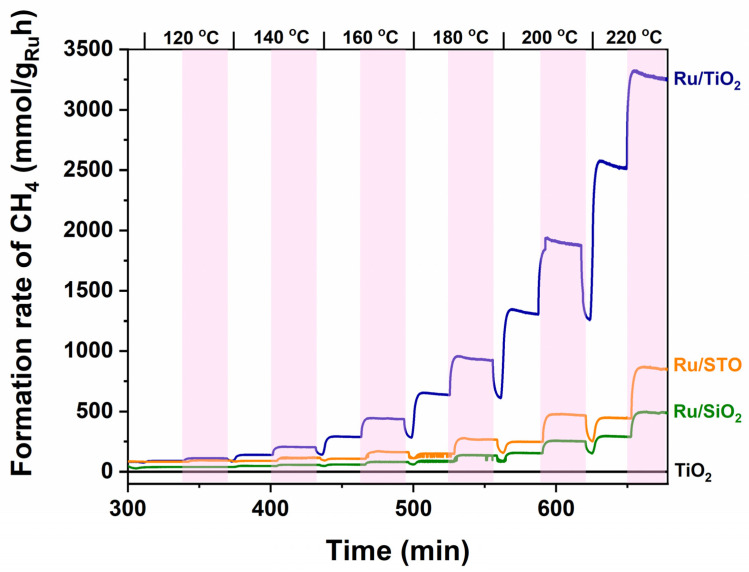
Ru/TiO2 catalysts are well known for their high activity in the hydrogenation of CO2 to CH4 (the Sabatier reaction). This activity is commonly attributed to strong metal-support interactions (SMSIs), associated with reducible oxide layers partly covering the Ru-metal particles. Moreover, isothermal rates of formation of CH4 can be significantly enhanced by the exposure of Ru/TiO2 to light of UV/visible wavelengths, even at relatively low intensities. In this study, we confirm the significant enhancement in the rate of formation of methane in the conversion of CO2, e.g., at 200 °C from ~1.2 mol gRu-1·h-1 to ~1.8 mol gRu-1·h-1 by UV/Vis illumination of a hydrogen-treated Ru/TiOx catalyst. The activation energy does not change upon illumination-the rate enhancement coincides with a temperature increase of approximately 10 °C in steady state (flow) conditions. In-situ DRIFT experiments, performed in batch mode, demonstrate that the Ru-CO absorption frequency is shifted and the intensity reduced by combined UV/Vis illumination in the temperature range of 200-350 °C, which is more significant than can be explained by temperature enhancement alone. Moreover, exposing the catalyst to either UV (predominantly exciting TiO2) or visible illumination (exclusively exciting Ru) at small intensities leads to very similar effects on Ru-CO IR intensities, formed in situ by exposure to CO2. This further confirms that the temperature increase is likely not the only explanation for the enhancement in the reaction rates. Rather, as corroborated by photophysical studies reported in the literature, we propose that illumination induces changes in the electron density of Ru partly covered by a thin layer of TiOx, lowering the CO coverage, and thus enhancing the methane formation rate upon illumination.
Keywords: CO coverage; CO2 hydrogenation; DRIFT spectroscopy; Ru/TiO2; charge transfer processes; heat; photothermal catalysis.
Conflict of interest statement
The authors declare no conflicts of interest.
Figures


Similar articles
-
Shaping Oxidation Catalysis of Multivalent Mixed Oxides by Dedicated Hydrogen Pretreatment.Acc Chem Res. 2025 Aug 25. doi: 10.1021/acs.accounts.5c00428. Online ahead of print. Acc Chem Res. 2025. PMID: 40854195
-
Systemic pharmacological treatments for chronic plaque psoriasis: a network meta-analysis.Cochrane Database Syst Rev. 2017 Dec 22;12(12):CD011535. doi: 10.1002/14651858.CD011535.pub2. Cochrane Database Syst Rev. 2017. Update in: Cochrane Database Syst Rev. 2020 Jan 9;1:CD011535. doi: 10.1002/14651858.CD011535.pub3. PMID: 29271481 Free PMC article. Updated.
-
Adefovir dipivoxil and pegylated interferon alfa-2a for the treatment of chronic hepatitis B: a systematic review and economic evaluation.Health Technol Assess. 2006 Aug;10(28):iii-iv, xi-xiv, 1-183. doi: 10.3310/hta10280. Health Technol Assess. 2006. PMID: 16904047
-
Behavioral interventions to reduce risk for sexual transmission of HIV among men who have sex with men.Cochrane Database Syst Rev. 2008 Jul 16;(3):CD001230. doi: 10.1002/14651858.CD001230.pub2. Cochrane Database Syst Rev. 2008. PMID: 18646068
-
Systemic pharmacological treatments for chronic plaque psoriasis: a network meta-analysis.Cochrane Database Syst Rev. 2021 Apr 19;4(4):CD011535. doi: 10.1002/14651858.CD011535.pub4. Cochrane Database Syst Rev. 2021. Update in: Cochrane Database Syst Rev. 2022 May 23;5:CD011535. doi: 10.1002/14651858.CD011535.pub5. PMID: 33871055 Free PMC article. Updated.
References
-
- Zhang F., Li Y.-H., Qi M.-Y., Yamada Y.M.A., Anpo M., Tang Z.-R., Xu Y.-J. Photothermal catalytic CO2 reduction over nanomaterials. Chem Catal. 2021;1:272–297. doi: 10.1016/j.checat.2021.01.003. - DOI
-
- Yang X., Tan F., Wang D., Feng Q., Qiu D., Dang D., Wang X. Entrapping Ru nanoparticles into TiO2 nanotube: Insight into the confinement synergy on boosting pho-thermal CO2 methanation activity. Ceram. Int. 2021;47:27316–27323. doi: 10.1016/j.ceramint.2021.06.153. - DOI
-
- Kondratenko E.V., Mul G., Baltrusaitis J., Larrazábal G.O., Pérez-Ramírez J. Status and perspectives of CO2 conversion into fuels and chemicals by catalytic, photocatalytic and electrocatalytic processes. Energy Environ. Sci. 2013;6:3112–3135. doi: 10.1039/c3ee41272e. - DOI
-
- Wang C., Fang S., Xie S., Zheng Y., Hu Y.H. Thermo-photo catalytic CO2 hydrogenation over Ru/TiO2. J. Mater. Chem. A. 2020;8:7390–7394. doi: 10.1039/C9TA13275A. - DOI
Grants and funding
LinkOut - more resources
Full Text Sources
Medical
