

Hyperspectral Imaging Study of Wheat Grains Infected with Several Fusarium Fungal Species and Their Identification with PCA-Based Approach
- PMID: 40572551
- PMCID: PMC12195891
- DOI: 10.3390/molecules30122586
Hyperspectral Imaging Study of Wheat Grains Infected with Several Fusarium Fungal Species and Their Identification with PCA-Based Approach
Abstract
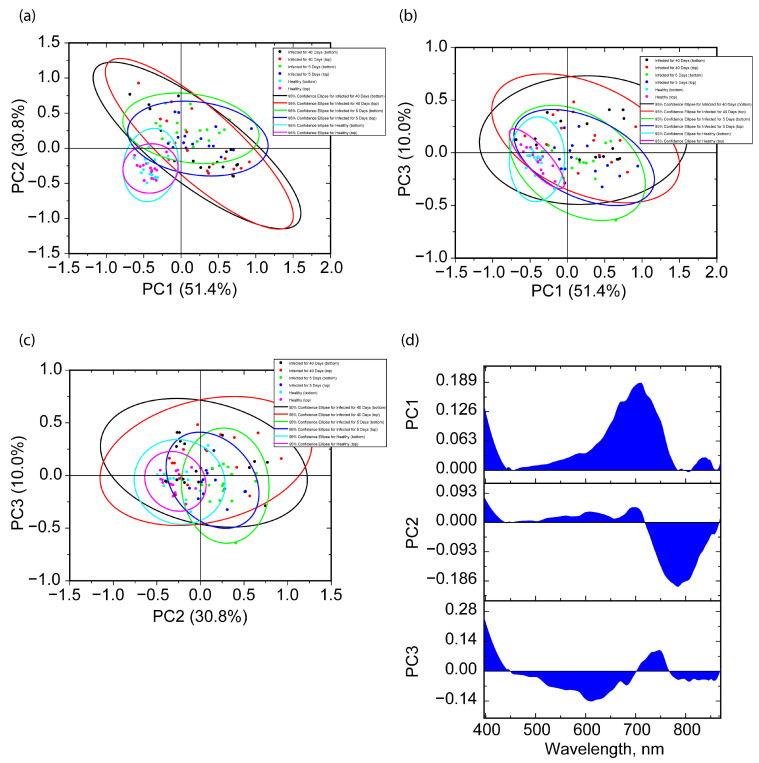
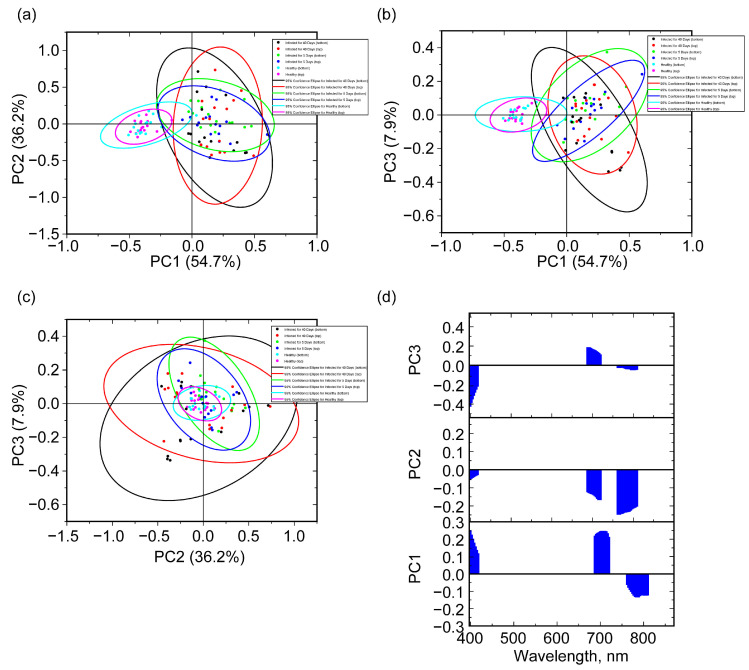
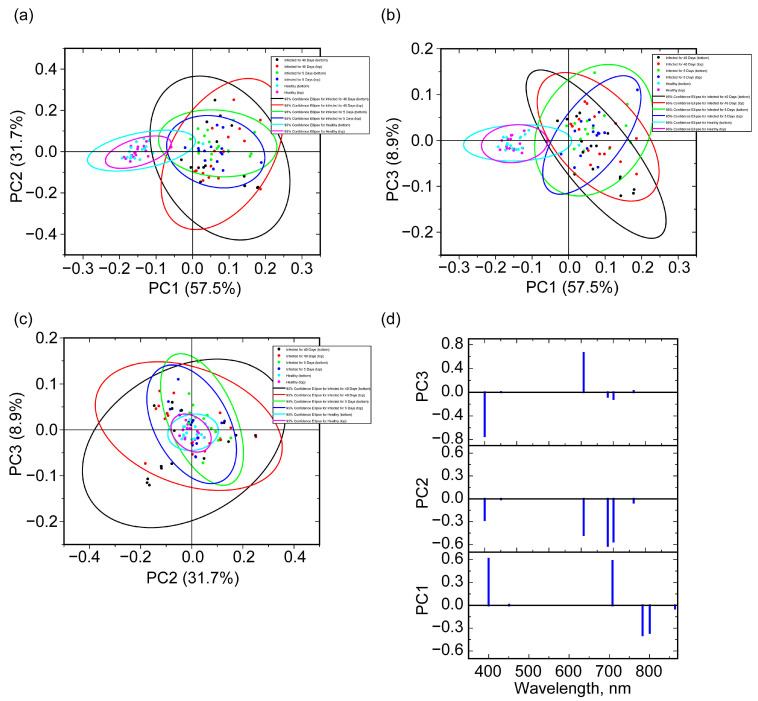
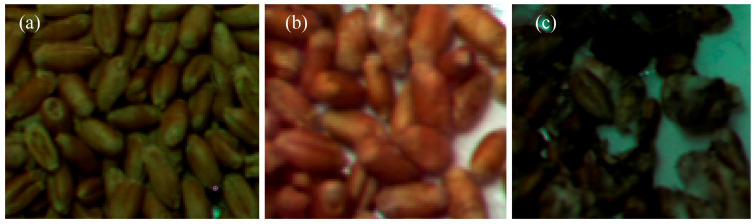
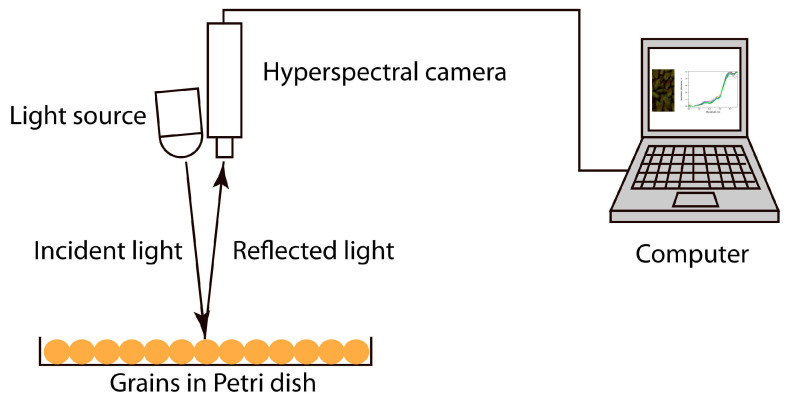
Wheat is an important agricultural crop grown under various conditions on five continents. The ability to promptly detect and defeat fungal diseases has a significant impact on the volume of the obtained harvest. One of the most significant threats to human and domestic animal health is metabolites produced by Fusarium genus fungi. In this regard, this work is devoted to the possibility of the rapid differentiation between healthy grains and grains simultaneously infected with several species of Fusarium genus fungi (Fusarium graminearum Schwabe FG-30, Fusarium poae Kr-20-14, Fusarium roseum (sambucinum) St-20-3) for practical reasons. An approach based on obtaining hyperspectral data with their subsequent processing using the principal component analysis (PCA) method and determining statistically important spectral regions sensitive for grain infection at different stages (5 and 40 days) was proposed. The effects of the grain orientation and data dimensionality on the classification result were studied. For further practical application in devices for the rapid identification of wheat grains infected with Fusarium, a method based on the use of reflection at wavelengths of 400, 451, 708, 783, 801, and 863 nm, together with normalization [0, 1] and the subsequent projection of spectral data onto the first three principal components (PCs), was proposed, regardless of the grain orientation.
Keywords: Fusarium; feature wavelength; hyperspectral imaging; reflectance; wheat.
Conflict of interest statement
The authors declare no conflicts of interest.
Figures
Similar articles
-
Citric acid impairs type B trichothecene biosynthesis of Fusarium graminearum but enhances its growth and pigment biosynthesis: transcriptomic and proteomic analyses.Appl Environ Microbiol. 2025 Jun 18;91(6):e0153124. doi: 10.1128/aem.01531-24. Epub 2025 May 14. Appl Environ Microbiol. 2025. PMID: 40366181 Free PMC article.
-
Significance of the Stability of Fusarium Head Blight Resistance in the Variety Registration, Breeding, and Genetic Research of Winter Wheat Using Disease Index, Fusarium-Damaged Kernels, and Deoxynivalenol Contamination.Toxins (Basel). 2025 Jun 6;17(6):288. doi: 10.3390/toxins17060288. Toxins (Basel). 2025. PMID: 40559866 Free PMC article.
-
A Novel Hybrid Technique for Detecting and Classifying Hyperspectral Images of Tomato Fungal Diseases Based on Deep Feature Extraction and Manhattan Distance.Sensors (Basel). 2025 Jul 9;25(14):4285. doi: 10.3390/s25144285. Sensors (Basel). 2025. PMID: 40732413 Free PMC article.
-
Systemic pharmacological treatments for chronic plaque psoriasis: a network meta-analysis.Cochrane Database Syst Rev. 2021 Apr 19;4(4):CD011535. doi: 10.1002/14651858.CD011535.pub4. Cochrane Database Syst Rev. 2021. Update in: Cochrane Database Syst Rev. 2022 May 23;5:CD011535. doi: 10.1002/14651858.CD011535.pub5. PMID: 33871055 Free PMC article. Updated.
-
The educational effects of portfolios on undergraduate student learning: a Best Evidence Medical Education (BEME) systematic review. BEME Guide No. 11.Med Teach. 2009 Apr;31(4):282-98. doi: 10.1080/01421590902889897. Med Teach. 2009. PMID: 19404891
References
-
- Reynolds M.P., Braun H.-J. Wheat Improvement. Springer International Publishing; Cham, Switzerland: 2022.
-
- Inamdar A., Sakhare S. Application of Color Sorter in Wheat Milling. Int. Food Res. J. 2014;21:2083–2089.
-
- Global Wheat Production from 1990/1991 to 2024/2025 (in Million Metric Tons) [(accessed on 29 May 2025)]. Available online: https://www.statista.com/statistics/267268/production-of-wheat-worldwide....
-
- Whetton R.L., Waine T.W., Mouazen A.M. Hyperspectral Measurements of Yellow Rust and Fusarium Head Blight in Cereal Crops: Part 2: On-Line Field Measurement. Biosyst. Eng. 2018;167:144–158. doi: 10.1016/j.biosystemseng.2018.01.004. - DOI
MeSH terms
Grants and funding
LinkOut - more resources
Full Text Sources
