. 2025 Jun 17;18(6):907.
doi: 10.3390/ph18060907.

Cold Atmospheric Plasma Improves the Therapeutic Success of Photodynamic Therapy on UV-B-Induced Squamous Cell Carcinoma in Hairless Mice

Affiliations

Cold Atmospheric Plasma Improves the Therapeutic Success of Photodynamic Therapy on UV-B-Induced Squamous Cell Carcinoma in Hairless Mice

Stephanie Arndt et al. Pharmaceuticals (Basel). .

Abstract

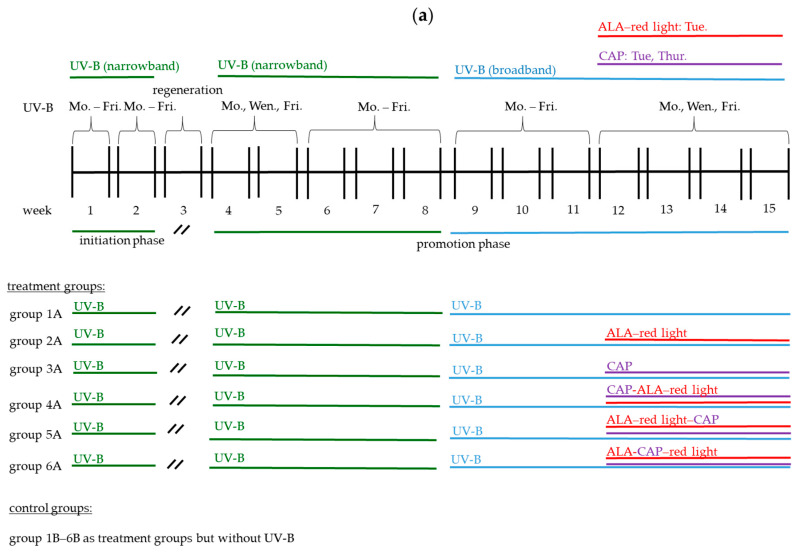
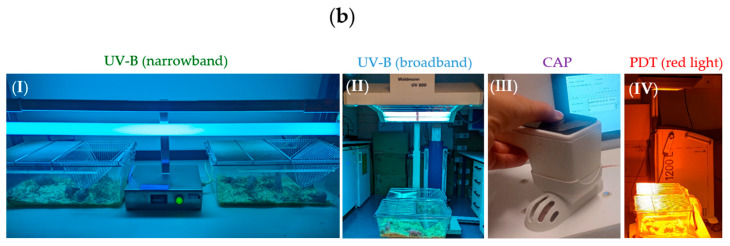
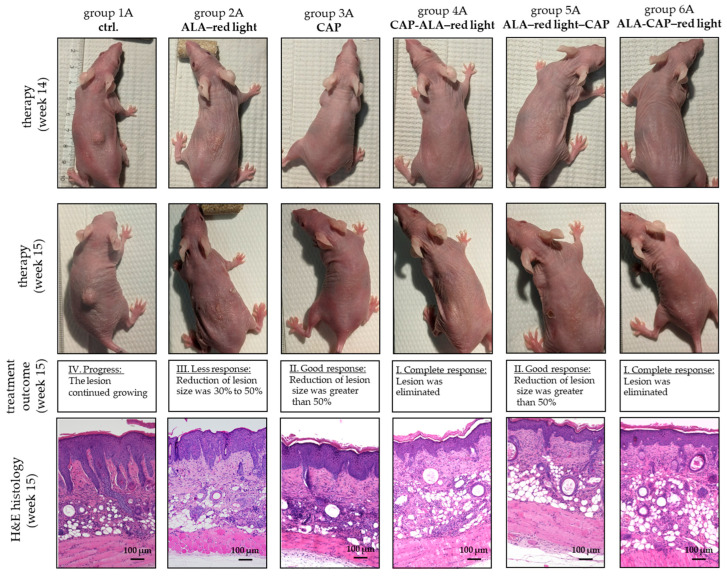
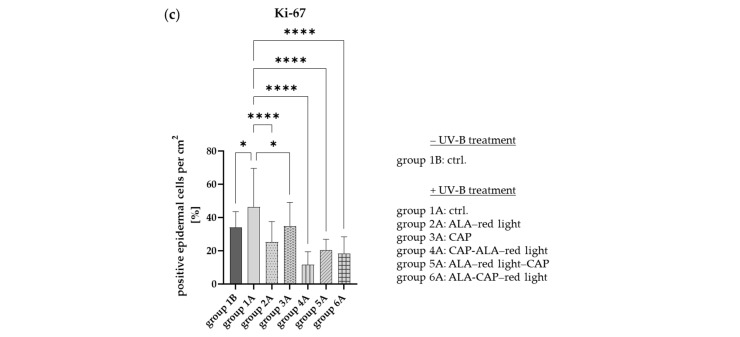
Background/Objectives: Actinic keratosis (AK) occurs on sun-damaged skin and is considered a precursor to squamous cell carcinoma (SCC). Photodynamic therapy (PDT), using 5-aminolevulinic acid (ALA) and red light, is a common treatment for AK. However, its clinical efficacy for invasive tumors such as SCC is limited by the poor penetration and distribution of the photosensitizer. Cold atmospheric plasma (CAP), a partially ionized gas, increases skin permeability and exhibits anti-cancer properties through the generation of reactive oxygen species (ROS). In a previous study, CAP showed promising synergistic effects when combined with ALA-PDT for the treatment of SCC cells in vitro. The present study investigated the effects of combining CAP with ALA-PDT on cutaneous AK and SCC induced by ultraviolet B (UV-B) irradiation in SKH1 hairless mice. Methods: We compared various application sequences (CAP-ALA-red light, ALA-red light-CAP, and ALA-CAP-red light) against conventional ALA-PDT using visual, histological, and molecular assessments of the affected skin. Results: The results demonstrated that combined treatments strongly inhibited the growth of UV-B-induced skin lesions. TUNEL staining revealed increased apoptosis following both single and combined therapies, while Ki-67 staining indicated reduced keratinocyte proliferation and diminished DNA damage in treated areas. mRNA expression analysis showed the upregulation of apoptosis-related genes (p16INK4a, p21CIP1) alongside enhanced anti-tumor immune responses (IL-6, IL-8) in the affected tissue samples. Notably, the combined treatment enhances the therapeutic effect, whereas the sequence of application does not seem to be relevant for therapeutic efficacy in vivo. Conclusions: Overall, these results suggest that CAP may enhance the anti-tumor effect of conventional ALA-PDT, supporting previous findings on SCC cells.

Keywords: 5-aminolaevulinic acid (ALA); actinic keratosis (AK); cold atmospheric plasma (CAP); photodynamic therapy (PDT); squamous cell carcinoma (SCC).


Conflict of interest statement

The authors declare no conflicts of interest. The funders had no role in the design of the study; in the collection, analyses, or interpretation of data; in the writing of the manuscript; or in the decision to publish the results.

Figures

Figure 4
Figure 4
The measurement of the epidermal thickness in UV-B-induced skin lesions and non-irradiated skin after different therapeutic interventions. (a) Sirius Red-Fast Green-stained paraffin sections of UV-B-induced tumor mice (groups 1A–6A) and UV-B non-irradiated mice (groups 1B–6B) after different treatments (ALA–red light, CAP, CAP-ALA–red light, ALA–red light–CAP, ALA-CAP–red light). (b) The area of the epidermis per field of view (10× objective) was calculated with the BZ-H4C software (Version 1.1.2.4, Keyence, Neu-Isenburg, Germany). (c) The epidermal area correlates with the epidermal thickness and is calculated for all animals (n = 7–8) per group, employing ctrl. group 1B set 1. Statistical analysis: Ordinary one-way ANOVA with Bonferroni’s multiple comparison test was performed to compare the mean of group 1A with the corresponding treatment groups (2A–6A). * p ≤ 0.05, ** p < 0.01, **** p < 0.0001.
Figure 8
Figure 8
Expression of cytokines and apoptosis-related molecules on mRNA level after different treatments (groups 2A–6A) and in untreated ctrl. skin (group 1A). (a,b) mRNA expression of cytokines (IL-6, IL-8) and (c,d) apoptosis-related molecules (p16INK4a, p21CIP1) isolated from full skin (epidermis and dermis) preparations. Expression intensity was indicated in arbitrary units (a.u.). Statistical analysis: Ordinary one-way ANOVA with Bonferroni’s multiple comparison test was performed to compare mean of ctrl. (group 1A) with all treatment groups (groups 2A–6A). Significant results were not detected.
Figure 1
Figure 1
(a) An overview of the treatment groups (1A–6A) and the control groups (1B–6B) with the corresponding treatment regime (ALA–red light, CAP, CAP-ALA–red light, ALA–red light–CAP, ALA-CAP–red light). ALA was always incubated for 3 h before CAP or red-light treatment were added. SKH1 female mice (n = 9 animals per group) from the treatment groups underwent a structured UV-B treatment regimen over 15 weeks. Initially, they received narrowband UV-B treatment for eight weeks, followed by a regeneration period in week 3. Transitioning to broadband UV-B treatment started in week 9 and therapeutic intervention started in week 12. Control groups (n = 8 animals per group) underwent the same treatment regime but without UV-B pretreatment. (b) Devices used for animal treatment. UV-B treatment with narrowband UV-B (I) (cumulative dose of 13.724 J/cm2; 16 min per treatment) and broadband UV-B (II) (cumulative dose of 14.31 J/cm2; 16 min per treatment) took place in the cages (n = 4–5 animals per cage). CAP treatment (III), on the other hand, took place in a specially designed individual animal treatment chamber to ensure the targeted CAP treatment of the tumors over the short treatment time of two minutes (plasma care device; terraplasma GmbH, Garching, Germany). Hence, red-light treatment (IV) (100 J/cm2; 160 mWatt/cm2; 10 min; PDT-1200L, Waldmann Medizintechnik, Schwenningen, Germany) took place in the cages (n = 4–5 animals per cage).
Figure 1
Figure 1
(a) An overview of the treatment groups (1A–6A) and the control groups (1B–6B) with the corresponding treatment regime (ALA–red light, CAP, CAP-ALA–red light, ALA–red light–CAP, ALA-CAP–red light). ALA was always incubated for 3 h before CAP or red-light treatment were added. SKH1 female mice (n = 9 animals per group) from the treatment groups underwent a structured UV-B treatment regimen over 15 weeks. Initially, they received narrowband UV-B treatment for eight weeks, followed by a regeneration period in week 3. Transitioning to broadband UV-B treatment started in week 9 and therapeutic intervention started in week 12. Control groups (n = 8 animals per group) underwent the same treatment regime but without UV-B pretreatment. (b) Devices used for animal treatment. UV-B treatment with narrowband UV-B (I) (cumulative dose of 13.724 J/cm2; 16 min per treatment) and broadband UV-B (II) (cumulative dose of 14.31 J/cm2; 16 min per treatment) took place in the cages (n = 4–5 animals per cage). CAP treatment (III), on the other hand, took place in a specially designed individual animal treatment chamber to ensure the targeted CAP treatment of the tumors over the short treatment time of two minutes (plasma care device; terraplasma GmbH, Garching, Germany). Hence, red-light treatment (IV) (100 J/cm2; 160 mWatt/cm2; 10 min; PDT-1200L, Waldmann Medizintechnik, Schwenningen, Germany) took place in the cages (n = 4–5 animals per cage).
Figure 2
Figure 2
UV-B-induced AK and SCC development in SKH1 hairless mice. (a) SKH1 female mice (n = 9 animals per group) underwent a structured UV-B treatment regimen over 15 weeks. Initially, they received narrowband UV-B treatment for 8 weeks, starting with a dose of 0.224 J/cm2 five times a week, followed by a regeneration period in week 3. The dose was gradually increased to 0.864 J/cm2 at weeks 7 and 8. After transitioning to broadband UV-B treatment at a dose of 0.530 J/cm2, optical skin lesions appeared in 90% of the treated animals by the end of week 9. Tumor development became more pronounced at weeks 9 to 11 (red circles), leading to therapeutic intervention starting in week 12, when tumor development could be observed macroscopically in all animals; (b) H&E histological staining (10× objective) was conducted exemplarily at this stage (week 12) to confirm tumor manifestation. (I) UV-B-untreated control skin (normal skin) of SKH1 hairless mice. The skin of the mice homozygous for the hr allele exhibits characteristic features, including multiple dermal cysts (black asterisks), sebaceous gland hyperplasia (gray arrows), and the epidermis composed of a thin layer (black arrow). (II) Actinic keratosis displaying hyperkeratosis (red arrow) and hyperproliferation of the epidermal layer (black arrow). (III) SCC in situ with hyperkeratosis (red arrow), hyperproliferation showing bulbous rete with the migration of individual dysplastic cell nests into the dermis (black bracket), many cystic vacuoles (black asterisks), and small keratin pearls (green asterisks). (IV) Invasive SCC shows multiple dysplastic squamous cell areas with big keratin pearls (green asterisks) reaching the dermis. (I) Mice from the UV-B-untreated ctrl. (group 1B) and (IIIV) mice from UV-B-induced tumor development group after a cumulative UV-B (narrowband) exposure of 13.724 J/cm2 and a cumulative UV-B (broadband) exposure of 7.95 J/cm2 within 11 weeks.
Figure 3
Figure 3
Responses of UV-B-induced skin lesions to different treatments. Representative photographs of untreated (ctrl.) animals (group 1A), ALA–red light (group 2A), CAP (group 3A), or combined treatments with different treatment sequences (CAP-ALA–red light (group 4A), ALA–red light–CAP (group 5A), and ALA-CAP–red light (group 6A)). Photographs were made just before therapy (week 11) and once per week during the four weeks of therapy (week 12 to 15). The animals were killed after therapy, and the affected skin areas were processed for histological and molecular biological examination. H&E histology shows the status quo of the skin after therapy (10× objective). The treatment success depended on the treatment regimen and was improved in every animal except the animals of the untreated ctrl. (group 1A).
Figure 3
Figure 3
Responses of UV-B-induced skin lesions to different treatments. Representative photographs of untreated (ctrl.) animals (group 1A), ALA–red light (group 2A), CAP (group 3A), or combined treatments with different treatment sequences (CAP-ALA–red light (group 4A), ALA–red light–CAP (group 5A), and ALA-CAP–red light (group 6A)). Photographs were made just before therapy (week 11) and once per week during the four weeks of therapy (week 12 to 15). The animals were killed after therapy, and the affected skin areas were processed for histological and molecular biological examination. H&E histology shows the status quo of the skin after therapy (10× objective). The treatment success depended on the treatment regimen and was improved in every animal except the animals of the untreated ctrl. (group 1A).
Figure 5
Figure 5
Ki-67 immunostaining of skin tissue sections. (a) Ki-67 expression of proliferating kerationcytes of basal cell layer (black arrows) in normal skin of SKH1 hairless mice. (b) Patched pattern of Ki-67 expression (red arrows) can be detected in UV-B-induced skin lesions without therapy (group 1A) and strong reduction in Ki-67 positive cells can be observed after different therapeutic interventions (groups 2A–6A). (c) Percentage of positive cells in epidermis per square centimeter was measured across three representative regions per image (from a sample of 7 to 8 animals per group) at 10× magnification. Statistical analysis: Ordinary one-way ANOVA with Bonferroni’s multiple comparison test was performed to compare the mean of ctrl. (group 1A) with all treatment groups (groups 2A–6A) and group 1B. * p ≤ 0.05, **** p < 0.0001.
Figure 5
Figure 5
Ki-67 immunostaining of skin tissue sections. (a) Ki-67 expression of proliferating kerationcytes of basal cell layer (black arrows) in normal skin of SKH1 hairless mice. (b) Patched pattern of Ki-67 expression (red arrows) can be detected in UV-B-induced skin lesions without therapy (group 1A) and strong reduction in Ki-67 positive cells can be observed after different therapeutic interventions (groups 2A–6A). (c) Percentage of positive cells in epidermis per square centimeter was measured across three representative regions per image (from a sample of 7 to 8 animals per group) at 10× magnification. Statistical analysis: Ordinary one-way ANOVA with Bonferroni’s multiple comparison test was performed to compare the mean of ctrl. (group 1A) with all treatment groups (groups 2A–6A) and group 1B. * p ≤ 0.05, **** p < 0.0001.
Figure 6
Figure 6
In situ TUNEL staining of tissue sections. Measurement of apoptosis in UV-B-induced skin lesions after different therapeutic interventions (ALA–red light, CAP, CAP-ALA–red light, ALA–red light–CAP, ALA-CAP–red light) and in untreated ctrl. animals are shown exemplarily. White arrows show apoptotic cells (green fluorescence staining) of stratum granulosum of epidermis. Red arrows show apoptotic cells (green fluorescence staining) in epithelial lining of cyst wall. Blue color shows DAPI staining in nucleus.
Figure 7
Figure 7
γH2AX immunostaining of skin tissue sections. (a) γH2AX, marker for DNA double-strand breaks (DSBs) from ionizing radiation, is not expressed in normal skin of SKH1 hairless mice. (b) Strong expression pattern of γH2AX was detected in UV-B-induced skin lesions (group 1A). Significantly fewer positive cells were observed in epidermis after ALA–red-light treatment (group 2A), whereas after CAP treatment, increase in γH2AX positive cells was detected compared to untreated control (group 1A). After double therapy, however, there was strong reduction in γH2AX expression in all treatment sequences applied (groups 4A–6A). Photos were taken with 10× objective. (c) Percentage of positive cells in epidermis per square centimeter was measured across three representative regions per image (from a sample of 7 to 8 animals per group) at 10× magnification. Statistical analysis: Ordinary one-way ANOVA with Bonferroni’s multiple comparison test was performed to compare mean of ctrl. (group 1A) with all treatment groups (groups 2A–6A) and group 1B. **** p < 0.0001.
Figure 7
Figure 7
γH2AX immunostaining of skin tissue sections. (a) γH2AX, marker for DNA double-strand breaks (DSBs) from ionizing radiation, is not expressed in normal skin of SKH1 hairless mice. (b) Strong expression pattern of γH2AX was detected in UV-B-induced skin lesions (group 1A). Significantly fewer positive cells were observed in epidermis after ALA–red-light treatment (group 2A), whereas after CAP treatment, increase in γH2AX positive cells was detected compared to untreated control (group 1A). After double therapy, however, there was strong reduction in γH2AX expression in all treatment sequences applied (groups 4A–6A). Photos were taken with 10× objective. (c) Percentage of positive cells in epidermis per square centimeter was measured across three representative regions per image (from a sample of 7 to 8 animals per group) at 10× magnification. Statistical analysis: Ordinary one-way ANOVA with Bonferroni’s multiple comparison test was performed to compare mean of ctrl. (group 1A) with all treatment groups (groups 2A–6A) and group 1B. **** p < 0.0001.

Similar articles

References

    1. Kandolf L., Peris K., Malvehy J., Mosterd K., Heppt M.V., Fargnoli M.C., Berking C., Arenberger P., Bylaite-Bučinskiene M., Del Marmol V. European consensus-based interdisciplinary guideline for diagnosis, treatment and prevention of actinic keratoses, epithelial UV-induced dysplasia and field cancerization on behalf of European Association of Dermato-Oncology, European Dermatology Forum, European Academy of Dermatology and Venereology and Union of Medical Specialists (Union Européenne des Médecins Spécialistes) J. Eur. Acad. Dermatol. Venereol. 2024;38:1024–1047. - PubMed
    1. George C.D., Lee T., Hollestein L.M., Asgari M.M., Nijsten T. Global epidemiology of actinic keratosis in the general population: A systematic review and meta-analysis. Br. J. Dermatol. 2024;190:465–476. doi: 10.1093/bjd/ljad371. - DOI - PubMed
    1. Green A.C., Soyer H., Prow T., Jemec G., editors. Epidemiology of actinic keratoses. Curr. Probl. Dermatol. 2014;46:1–7. - PubMed
    1. Rosen T., Lebwohl M.G. Prevalence and awareness of actinic keratosis: Barriers and opportunities. J. Am. Acad. Dermatol. 2013;68:S2–S9. doi: 10.1016/j.jaad.2012.09.052. - DOI - PubMed
    1. Agarwal K., Podder I., Cockerell C.J., Kassir M., Grabbe S., Goldust M. Update on diagnosis and treatment of actinic keratosis. Dermatol. Rev. 2022;3:359–368. doi: 10.1002/der2.121. - DOI

LinkOut - more resources