Comparative Study
. 2025 May 27;17(6):762.
doi: 10.3390/v17060762.

Comparative Analysis of Two Zika Virus Isolates in a Rhesus Macaque Pregnancy Model

Affiliations
Comparative Study

Comparative Analysis of Two Zika Virus Isolates in a Rhesus Macaque Pregnancy Model

Hannah K Jaeger et al. Viruses. .

Abstract

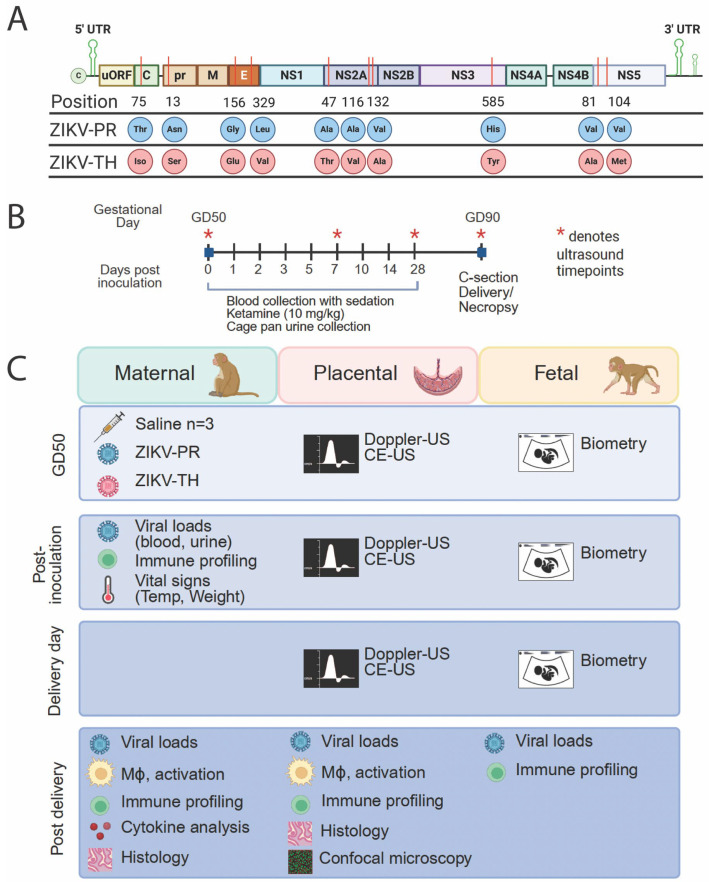
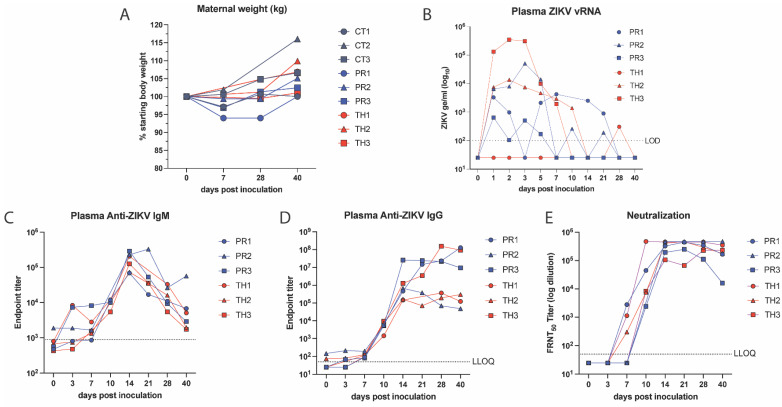
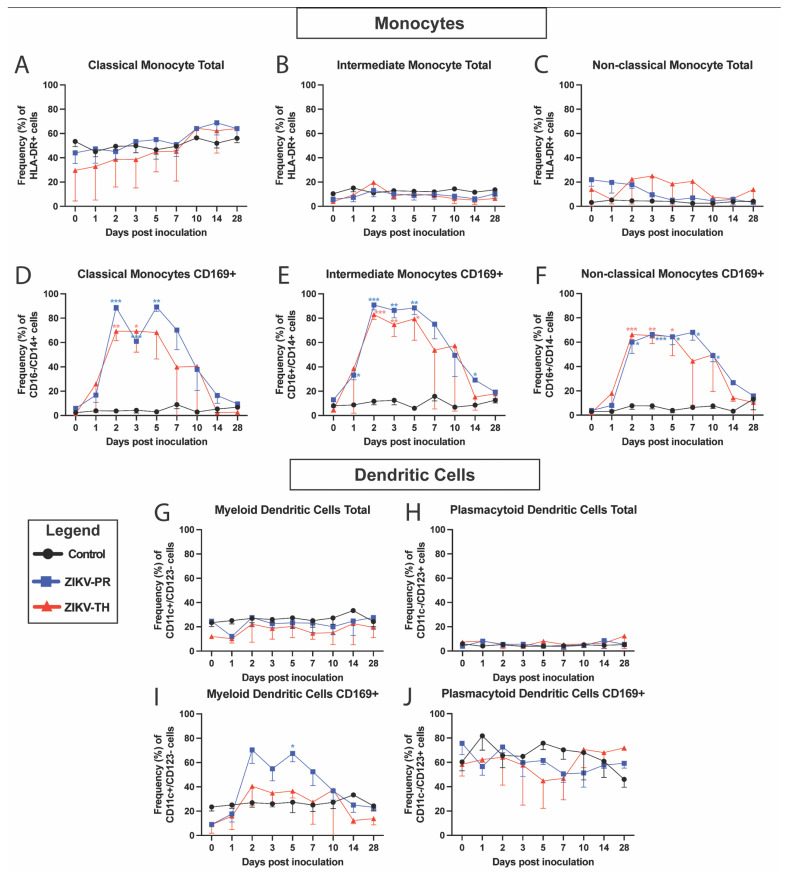
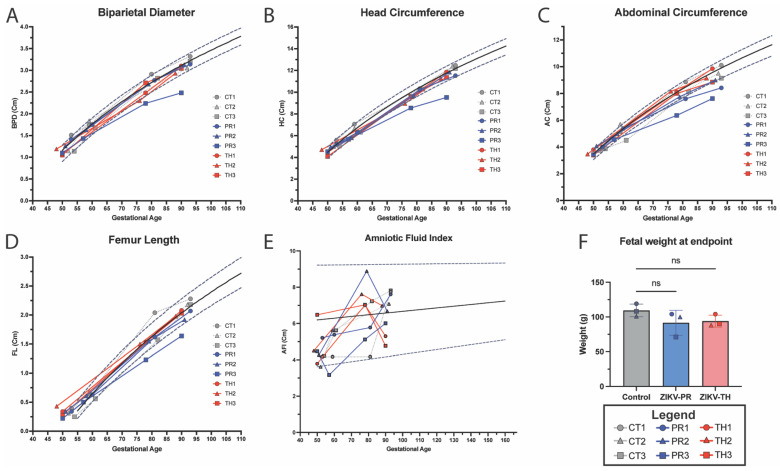
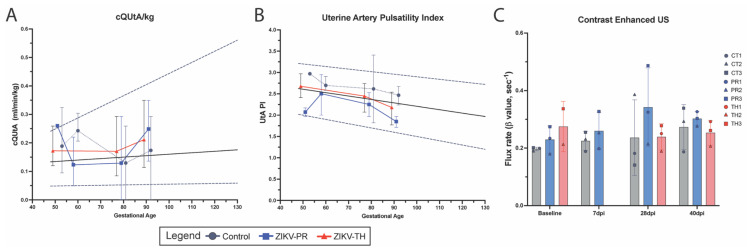
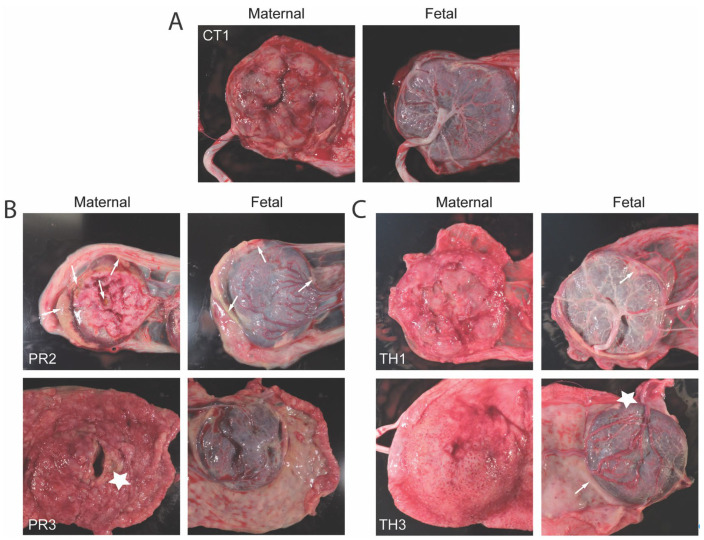
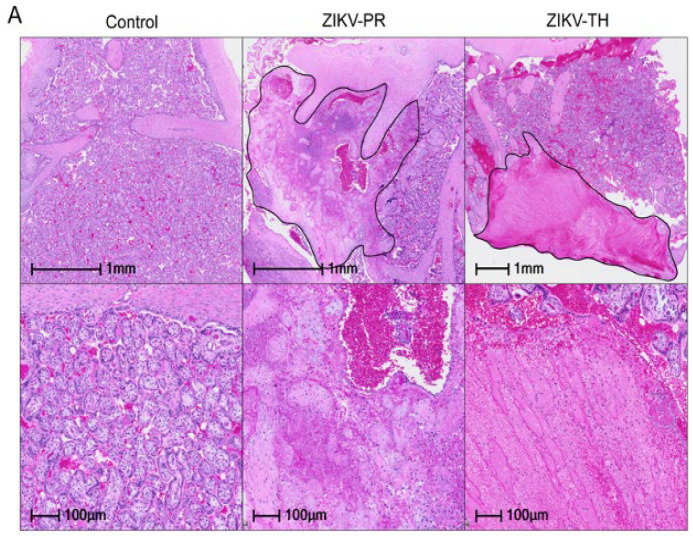
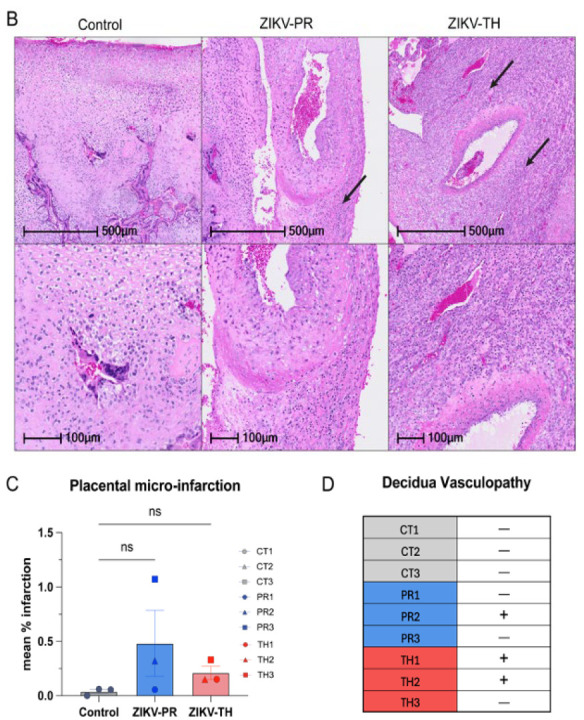
Zika virus (ZIKV) infection during pregnancy can cause a broad range of neurological birth defects, collectively named Congenital Zika Syndrome (CZS). We have previously shown that infection with the Puerto Rican isolate PRVABC59 (ZIKV-PR) results in abnormal oxygen transport in the placenta due to villous damage and uterine vasculitis in a nonhuman primate model. To investigate whether this type of damage occurs with endemically circulating strains in Thailand, we investigated a CZS case isolate, MU1-2017 (ZIKV-TH), in pregnant rhesus macaques. Pregnant animals (n = 3 per group) were infected subcutaneously with either ZIKV-PR or ZIKV-TH at ~50 days gestation (GD) and monitored for 40 days post-infection (GD90). Similar courses of viremia and immune activation were observed for both viruses when compared to uninfected controls. In addition, both viruses induced changes to the placental architecture, including spiral artery remodeling and the development of infarctions. Similar levels of viral RNA were detected at necropsy in maternal and fetal tissues. Overall, our results show that the ZIKV-TH strain MU1-2017 behaves similarly to the ZIKV-PR strain, and, importantly, provide evidence of in-utero infection with an additional contemporary strain of ZIKV.

Keywords: Thailand; Zika virus; congenital Zika syndrome; immunology; non-human primate; placenta.


Conflict of interest statement

The authors declare no conflicts of interest.

Figures

Figure 1
Figure 1
Study design and viral phylogeny of viruses used in non-human primate studies. (A) Viral genome alignment between PRVABC59 and MU1-2017 (MF996804) was performed using Benchling (https://www.benchling.com/, accessed on 30 November 2024) to assess sequence identity and variations. The final alignment was based upon sequencing performed post-inoculation, using virus isolated from rhesus macaque tissues. Positions are listed based on the beginning of each gene. (B) Nine rhesus macaque pregnancies were grouped into either ZIKV-inoculated or controls. On gestational day (GD) 50 (±2 days), animals were exposed subcutaneously (SQ) to either saline, ZIKV-PR, or ZIKV-TH. (C) Viral loads, immune cell profiling, antibody kinetics, and vital signs were monitored longitudinally for each group. Maternal–fetal interface (MFI) and fetal/embryonic tissues were collected on the date of necropsy at GD90 via C-section. Graphics were created in BioRender. Jaeger, H. K. (2025) https://BioRender.com/840g793 (accessed on 28 April 2025).
Figure 2
Figure 2
Maternal viremia and characterization of ZIKV-specific antibodies. (A) Maternal body weight was measured in kg, graphed as the percentage of starting weight for each animal. (B), Maternal plasma viremia was detected via qRT-PCR and is representative of three technical replicates. The LOD was 100 copies of ZIKV RNA per mL of plasma with undetectable samples graphed as 50 copies vRNA/mL plasma. (C,D) The development of ZIKV-binding IgM and IgG isotype antibody titers was quantified in macaque plasma at indicated timepoints using ELISA. Detection levels at day 0 were used to perform background subtraction (dashed line) to normalize the responses for IgM and the lower limit of detection (LLOQ) for both assays was 1:50. (E) The longitudinal development of ZIKV-neutralizing antibodies was quantified in ZIKV neutralization assays using the ZIKV-PR strain as the antigen and heat-inactivated macaque plasma at indicated time points post-inoculation. The 50% focus reduction neutralization titers (FRNT50) were determined using non-linear regression and graphed using GraphPad Prism v10.2. The lower limit of quantification was a 1:50 plasma dilution and undetectable values were graphed as half of the LLOQ.
Figure 3
Figure 3
Longitudinal peripheral blood innate immune cell phenotype and activation. Rhesus macaque PBMC isolated at the indicated time points were stained with antibodies directed against cellular markers and analyzed for cell phenotype using flow cytometry. Changes in the longitudinal frequency of both total (AC) and activated CD169+ (DF) for classical monocytes, non-classical monocytes, and intermediate monocytes were quantified. Dendritic cells were separated into myeloid dendritic cells, and plasmacytoid dendritic cells were quantified as total (G,H) and activated CD169+ (I,J). Lines represent mean frequencies of the three animals for Control (black), ZIKV-PR (blue), ZIKV-TH (red), and error bars represent the standard error of the mean. Longitudinal changes in total or activated (CD169+) cells in the peripheral blood were analyzed using a mixed model approach with a Greenhouse–Geisser correction followed by Tukey’s multiple comparisons of control animals to ZIKV infected for each day post inoculation; for this analysis, only significant comparisons are shown: *** p = 0.0001, ** p < 0.001, and * p < 0.05.
Figure 4
Figure 4
Fetal growth measured through ultrasound, amniotic fluid index, and fetal weight. Longitudinal ultrasound measurements of fetal growth across gestation including (A) Biparietal Diameter (BPD), (B) Head Circumference (HC), (C) Abdominal Circumference, and (D) Femur length in the six ZIKV-infected fetuses with control animals (n = 3) in gray, ZIKV-PR (n = 3) in blue, and ZIKV-TH (n = 3) in red plotted against historical controls, from ONPRC published data used to calculate the logarithmic regression for 50th percentile (black solid line) and for 10th and 90th percentiles, respectively (dashed lines). (E) Amniotic Fluid Index data were obtained by standard measurement of four quadrants and plotted against historical control with the logarithmic regression representing for 50th percentile (black solid line) and for 5th and 95th percentiles, respectively (dashed lines). (F) Fetal weight at necropsy (~GD 90) was measured in grams and analyzed using a one-way ANOVA (ns = p > 0.05) in GraphPad Prism v10.2.
Figure 5
Figure 5
Uteroplacental hemodynamics. Uterine artery (UtA) Doppler measurements and calculations were performed using standard practices. Shown is the linear regression for the 50th percentile (solid line) and for 5th and 95th percentiles, respectively (dashed lines), based upon ONPRC historical data. (A) UtA blood flow (cQtA/kg) corrected for maternal body weight was calculated using the UtA diameter, maternal UtA cross-sectional area and volume of blood flow through the maternal UtA. (B) Doppler measurements were also used to calculate the UtA Pulsatility Index (PI). Graphs show averaged measurements and gestational ages for control animals (gray), ZIKV-PR (blue), and ZIKV-TH (red). (C) Contrast-enhanced ultrasound (CE-US) was used to measure the microvascular flux rate from control, ZIKV-PR, and ZIKV-TH groups, stratified across days post-infection.
Figure 6
Figure 6
Gross placental pathology demonstrates infarction for ZIKV infection groups. (A) Control placenta at GD90 shown as a comparison of normal. (B) ZIKV-PR or (C) ZIKV-TH representative images of both maternal and fetal sides of the placenta. Milky-white appearance that is indicative of white blood cell infiltration is denoted by white arrows. Gross signs of infarction are indicated by white stars.
Figure 7
Figure 7
Placental histopathology of ZIKV-infected cases compared with gestational-age-matched negative controls. (A) Representative hematoxylin and eosin (H&E)–stained placental sections show infarctions (outlined in black) at low (top) and high (bottom) magnification. All six ZIKV-infected pregnancies exhibited infarctions in at least one cotyledon. All scale bars are shown in black with the top row at 1 mm and the bottom at 100 µm; original images were acquired at 20× magnification. (B) Representative hematoxylin and eosin (H&E) also showed chronic deciduitis with plasma cells and lymphoplasmacytic leukocytoclastic vasculitis (black arrows) in ZIKV-infected cases. Histological assessment of infarction was performed on 12–20 full-thickness placental sections collected from each cotyledon across both lobes of the placenta. Scale bars are shown in black with the top row at 500 µm and the bottom at 100 µm; original images were acquired at 20× magnification. (C) The percentage of infarcted sections per animal was quantified by a board-certified pathologist blinded to treatment group. Error bars represent standard deviation between animals (n = 3 per group). Statistical analysis was performed using a one-way ANOVA in Prism; ns = not significant (p > 0.05). (D) Presence (+) or absence (–) of decidual vasculopathy in at least one cotyledon is indicated for each case. All scale bars are shown in black; original images were acquired at 20× magnification.
Figure 7
Figure 7
Placental histopathology of ZIKV-infected cases compared with gestational-age-matched negative controls. (A) Representative hematoxylin and eosin (H&E)–stained placental sections show infarctions (outlined in black) at low (top) and high (bottom) magnification. All six ZIKV-infected pregnancies exhibited infarctions in at least one cotyledon. All scale bars are shown in black with the top row at 1 mm and the bottom at 100 µm; original images were acquired at 20× magnification. (B) Representative hematoxylin and eosin (H&E) also showed chronic deciduitis with plasma cells and lymphoplasmacytic leukocytoclastic vasculitis (black arrows) in ZIKV-infected cases. Histological assessment of infarction was performed on 12–20 full-thickness placental sections collected from each cotyledon across both lobes of the placenta. Scale bars are shown in black with the top row at 500 µm and the bottom at 100 µm; original images were acquired at 20× magnification. (C) The percentage of infarcted sections per animal was quantified by a board-certified pathologist blinded to treatment group. Error bars represent standard deviation between animals (n = 3 per group). Statistical analysis was performed using a one-way ANOVA in Prism; ns = not significant (p > 0.05). (D) Presence (+) or absence (–) of decidual vasculopathy in at least one cotyledon is indicated for each case. All scale bars are shown in black; original images were acquired at 20× magnification.

Similar articles

References

    1. Gregory C.J., Oduyebo T., Brault A.C., Brooks J.T., Chung K.W., Hills S., Kuehnert M.J., Mead P., Meaney-Delman D., Rabe I., et al. Modes of Transmission of Zika Virus. J. Infect. Dis. 2017;216:S875–S883. doi: 10.1093/infdis/jix396. - DOI - PMC - PubMed
    1. Gong Z., Gao Y., Han G.Z. Zika Virus: Two or Three Lineages? Trends Microbiol. 2016;24:521–522. doi: 10.1016/j.tim.2016.05.002. - DOI - PubMed
    1. Haddow A.D., Schuh A.J., Yasuda C.Y., Kasper M.R., Heang V., Huy R., Guzman H., Tesh R.B., Weaver S.C. Genetic characterization of Zika virus strains: Geographic expansion of the Asian lineage. PLoS Negl. Trop. Dis. 2012;6:e1477. doi: 10.1371/journal.pntd.0001477. - DOI - PMC - PubMed
    1. Lanciotti R.S., Lambert A.J., Holodniy M., Saavedra S., Signor Ldel C. Phylogeny of Zika Virus in Western Hemisphere, 2015. Emerg. Infect. Dis. 2016;22:933–935. doi: 10.3201/eid2205.160065. - DOI - PMC - PubMed
    1. Musso D., Gubler D.J. Zika Virus. Clin. Microbiol. Rev. 2016;29:487–524. doi: 10.1128/CMR.00072-15. - DOI - PMC - PubMed

Publication types

Associated data

LinkOut - more resources