. 2025 Jun 11;25(12):3664.
doi: 10.3390/s25123664.

A Novel Bilateral Data Fusion Approach for EMG-Driven Deep Learning in Post-Stroke Paretic Gesture Recognition

Affiliations

A Novel Bilateral Data Fusion Approach for EMG-Driven Deep Learning in Post-Stroke Paretic Gesture Recognition

Alexey Anastasiev et al. Sensors (Basel). .

Abstract

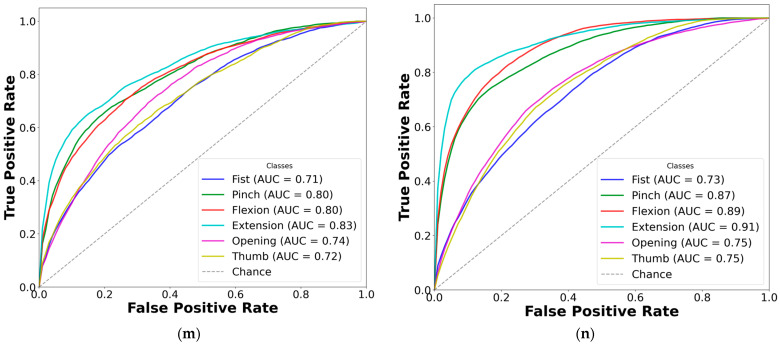
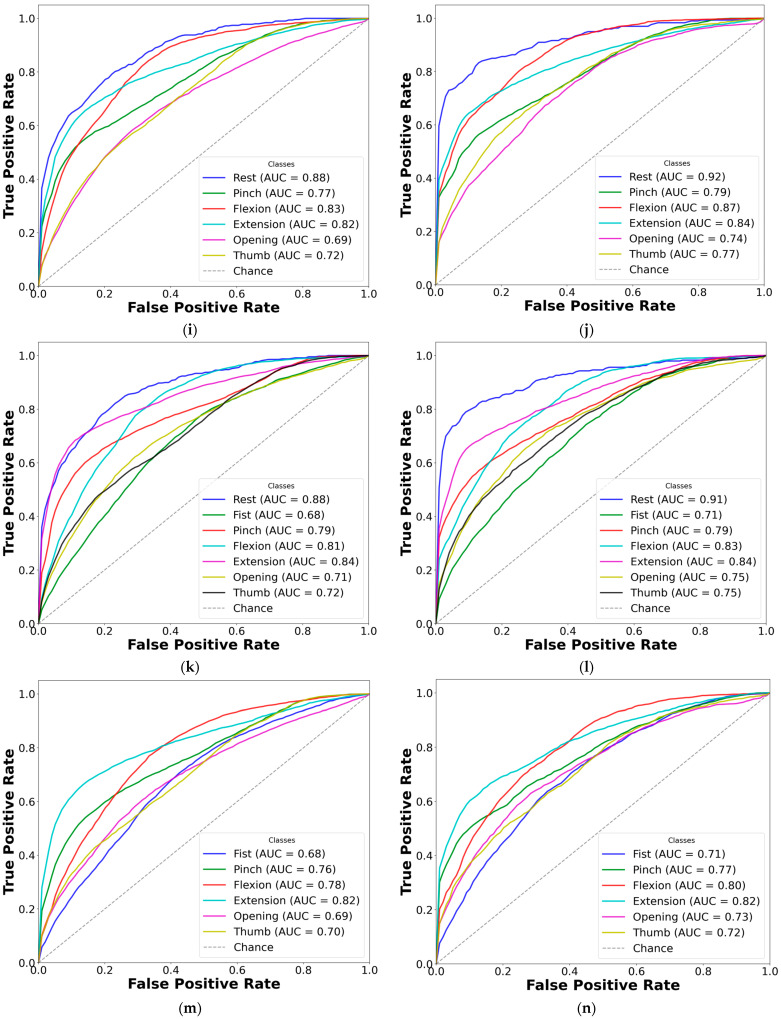
We introduce a hybrid deep learning model for recognizing hand gestures from electromyography (EMG) signals in subacute stroke patients: the one-dimensional convolutional long short-term memory neural network (CNN-LSTM). The proposed network was trained, tested, and cross-validated on seven hand gesture movements, collected via EMG from 25 patients exhibiting clinical features of paresis. EMG data from these patients were collected twice post-stroke, at least one week apart, and divided into datasets A and B to assess performance over time while balancing subject-specific content and minimizing training bias. Dataset A had a median post-stroke time of 16.0 ± 8.6 days, while dataset B had a median of 19.2 ± 13.7 days. In classification tests based on the number of gesture classes (ranging from two to seven), the hybrid model achieved accuracies ranging from 85.66% to 82.27% in dataset A and from 88.36% to 81.69% in dataset B. To address the limitations of deep learning with small datasets, we developed a novel bilateral data fusion approach that incorporates EMG signals from the non-paretic limb during training. This approach significantly enhanced model performance across both datasets, as evidenced by improvements in sensitivity, specificity, accuracy, and F1-score metrics. The most substantial gains were observed in the three-gesture subset, where classification accuracy increased from 73.01% to 78.42% in dataset A, and from 77.95% to 85.69% in dataset B. In conclusion, although these results may be slightly lower than those of traditional supervised learning algorithms, the combination of bilateral data fusion and the absence of feature engineering offers a novel perspective for neurorehabilitation, where every data segment is critically significant.

Keywords: CNN-LSTM; deep learning; electromyography (EMG); hand gesture recognition; healthcare; machine learning; neurorehabilitation; paresis; stroke; upper extremity motor impairment.


Conflict of interest statement

The authors declare no conflicts of interest.

Figures

Figure 1
Figure 1
This figure illustrates the selected hand gestures performed during post-stroke movement attempts on both the affected and non-affected sides. The gestures are displayed in the sequential order of the EMG recordings: (a) resting state (rest), (b) clenched fist, (c) index pinch, (d) wrist flexion, (e) wrist extension, (f) spread hand (fingers opening), and (g) upright thumb (thumbs up).
Figure 2
Figure 2
The representative EMG recordings performed by stroke patients using their unaffected upper extremity, with each gesture executed in sequential order. The x-axis represents the recording time in seconds (s), while the y-axis denotes the EMG amplitude in mV. Surface EMG signals were acquired using bipolar electrodes placed over four specific forearm muscle regions: Channel 1 over the flexor carpi radialis, Channel 2 over the flexor carpi ulnaris, Channel 3 over the thenar eminence targeting the abductor pollicis brevis and flexor pollicis brevis, and Channel 4 over the extensor digitorum communis. The initial recording segment captures the pre-calibration and resting state.
Figure 3
Figure 3
The representative EMG recordings performed by stroke patients using their affected upper extremity, with each gesture executed in sequential order. The x-axis represents the recording time in seconds (s), while the y-axis denotes the EMG amplitude in mV. Surface EMG signals were acquired using bipolar electrodes placed over four specific forearm muscle regions: Channel 1 over the flexor carpi radialis, Channel 2 over the flexor carpi ulnaris, Channel 3 over the thenar eminence targeting the abductor pollicis brevis and flexor pollicis brevis, and Channel 4 over the extensor digitorum communis. The initial recording segment captures the pre-calibration and resting state.
Figure 4
Figure 4
Settings of the clinical trial assessing bilateral data fusion in subacute stroke. Using an 8-channel EMG device (8CH HUB 19022021), four bipolar surface electrode pairs were placed on each forearm and hand. After patients were positioned at the table in the controlled environment, they performed sequential hand movements or movement attempts with their unaffected (i.e., non-paretic) and affected (i.e., paretic) upper extremities, completing at least 10 attempts per gesture class. After recording, the data were processed into an EMG dataset and split into training (data from both extremities) and testing sets (data from the affected extremity only). This was followed by 10-fold cross-validation, iterated 100 times, to correctly classify the intentional paretic gesture for each attempt using DL, leveraging the bilateral data fusion approach.
Figure 5
Figure 5
EMG-driven CNN-LSTM neural network architecture for decoding paretic hand gestures.
Figure 6
Figure 6
Bilateral data fusion of paretic and non-paretic hand gestures in post-stroke patients. E—number of iterations in cross-validation; the green circle represents non-paretic gestures concatenated into subsets; the red circle represents paretic data, randomly selected during cross-validation; the combined circle represents the fused data during training.
Figure 7
Figure 7
Comparison of AUC-ROC curves from cross-validated EMG hand gesture classification using dataset A. The left plots illustrate cross-validation results using paretic-only data, while the right plots show results from the bilateral data fusion approach. Each ROC curve represents a distinct gesture class within the specified subset: (a) two-gesture subset (paretic); (b) two-gesture subset (fused); (c) three-gesture subset (paretic); (d) three-gesture subset (fused); (e) four-gesture subset (paretic); (f) four-gesture subset (fused); (g) five-gesture subset (paretic); (h) five-gesture subset (fused); (i) six-gesture subset (paretic); (j) six-gesture subset (fused); (k) all-in-one seven-gesture set (paretic); (l) all-in-one seven-gesture set (fused); (m) six-gesture subset excluding rest (paretic); (n) six-gesture subset excluding rest (fused). AUC—area under the curve, and ROC—receiver operating characteristic curve. The dashed diagonal line represents the baseline of random guessing.
Figure 7
Figure 7
Comparison of AUC-ROC curves from cross-validated EMG hand gesture classification using dataset A. The left plots illustrate cross-validation results using paretic-only data, while the right plots show results from the bilateral data fusion approach. Each ROC curve represents a distinct gesture class within the specified subset: (a) two-gesture subset (paretic); (b) two-gesture subset (fused); (c) three-gesture subset (paretic); (d) three-gesture subset (fused); (e) four-gesture subset (paretic); (f) four-gesture subset (fused); (g) five-gesture subset (paretic); (h) five-gesture subset (fused); (i) six-gesture subset (paretic); (j) six-gesture subset (fused); (k) all-in-one seven-gesture set (paretic); (l) all-in-one seven-gesture set (fused); (m) six-gesture subset excluding rest (paretic); (n) six-gesture subset excluding rest (fused). AUC—area under the curve, and ROC—receiver operating characteristic curve. The dashed diagonal line represents the baseline of random guessing.
Figure 8
Figure 8
Comparison of AUC-ROC curves from cross-validated EMG hand gesture classification using dataset B. The left plots represent cross-validation results using paretic-only data, while the right plots display results from the bilateral data fusion approach. Each ROC curve corresponds to a distinct gesture class within the specified subset: (a) two-gesture subset (paretic); (b) two-gesture subset (fused); (c) three-gesture subset (paretic); (d) three-gesture subset (fused); (e) four-gesture subset (paretic); (f) four-gesture subset (fused); (g) five-gesture subset (paretic); (h) five-gesture subset (fused); (i) six-gesture subset (paretic); (j) six-gesture subset (fused); (k) all-in-one seven-gesture set (paretic); (l) all-in-one seven-gesture set (fused); (m) six-gesture subset excluding rest (paretic); (n) six-gesture subset excluding rest (fused). AUC—area under the curve, and ROC—receiver operating characteristic curve. The dashed diagonal line represents the baseline performance of random guessing.
Figure 8
Figure 8
Comparison of AUC-ROC curves from cross-validated EMG hand gesture classification using dataset B. The left plots represent cross-validation results using paretic-only data, while the right plots display results from the bilateral data fusion approach. Each ROC curve corresponds to a distinct gesture class within the specified subset: (a) two-gesture subset (paretic); (b) two-gesture subset (fused); (c) three-gesture subset (paretic); (d) three-gesture subset (fused); (e) four-gesture subset (paretic); (f) four-gesture subset (fused); (g) five-gesture subset (paretic); (h) five-gesture subset (fused); (i) six-gesture subset (paretic); (j) six-gesture subset (fused); (k) all-in-one seven-gesture set (paretic); (l) all-in-one seven-gesture set (fused); (m) six-gesture subset excluding rest (paretic); (n) six-gesture subset excluding rest (fused). AUC—area under the curve, and ROC—receiver operating characteristic curve. The dashed diagonal line represents the baseline performance of random guessing.

References

    1. Yeung A.W.K., Torkamani A., Butte A.J., Glicksberg B.S., Schuller B., Rodriguez B., Ting D.S., Bates D., Schaden E., Peng H., et al. The Promise of Digital Healthcare Technologies. Front. Public Health. 2023;11:1196596. doi: 10.3389/fpubh.2023.1196596. - DOI - PMC - PubMed
    1. Sumner J., Lim H.W., Chong L.S., Bundele A., Mukhopadhyay A., Kayambu G. Artificial Intelligence in Physical Rehabilitation: A Systematic Review. Artif. Intell. Med. 2023;146:102693. doi: 10.1016/j.artmed.2023.102693. - DOI - PubMed
    1. O’Brien M.K., Lanotte F., Khazanchi R., Shin S.Y., Lieber R.L., Ghaffari R., Rogers J.A., Jayaraman A. Early Prediction of Poststroke Rehabilitation Outcomes Using Wearable Sensors. Phys. Ther. 2024;104:pzad183. doi: 10.1093/ptj/pzad183. - DOI - PMC - PubMed
    1. Sakamoto D., Hamaguchi T., Nakayama Y., Hada T., Abo M. Upper-Limb Functional Recovery in Chronic Stroke Patients after COVID-19-Interrupted Rehabilitation: An Observational Study. J. Clin. Med. 2024;13:2212. doi: 10.3390/jcm13082212. - DOI - PMC - PubMed
    1. Lang C.E., Waddell K.J., Barth J., Holleran C.L., Strube M.J., Bland M.D. Upper Limb Performance in Daily Life Approaches Plateau Around Three to Six Weeks Post-Stroke. Neurorehabilit. Neural Repair. 2021;35:903–914. doi: 10.1177/15459683211041302. - DOI - PMC - PubMed

LinkOut - more resources