

Effects of Sampling Frequency on Human Activity Recognition with Machine Learning Aiming at Clinical Applications
- PMID: 40573667
- PMCID: PMC12196717
- DOI: 10.3390/s25123780
Effects of Sampling Frequency on Human Activity Recognition with Machine Learning Aiming at Clinical Applications
Abstract
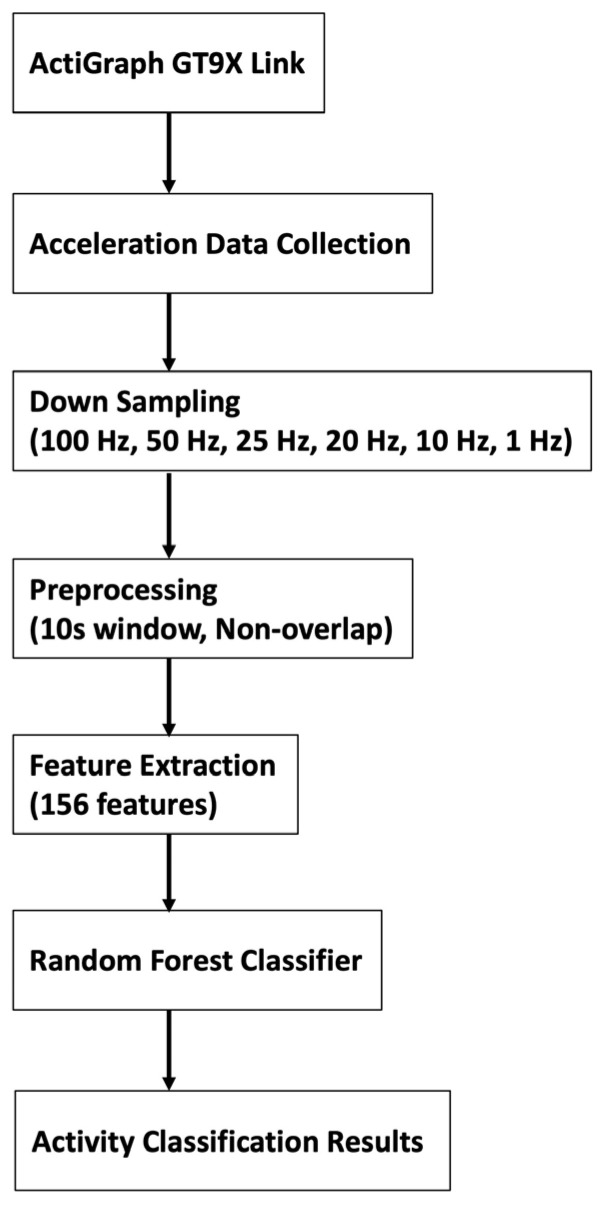
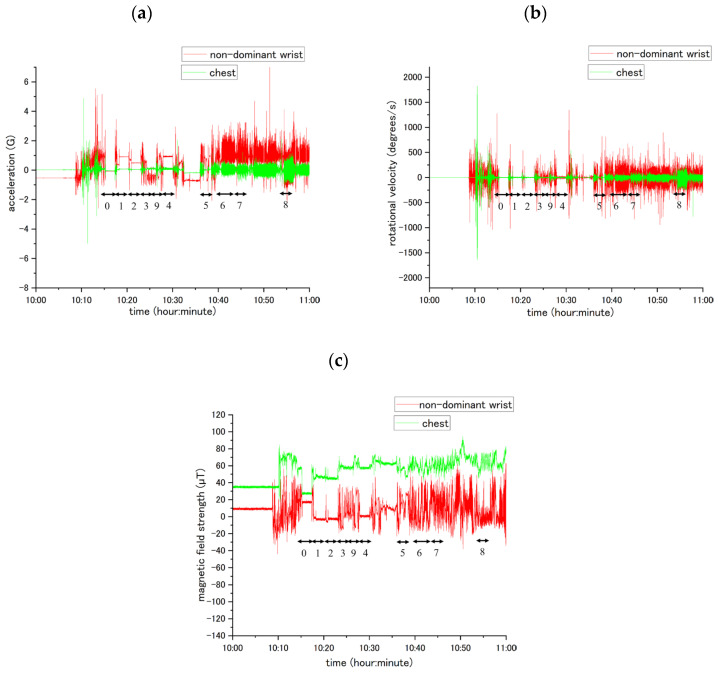
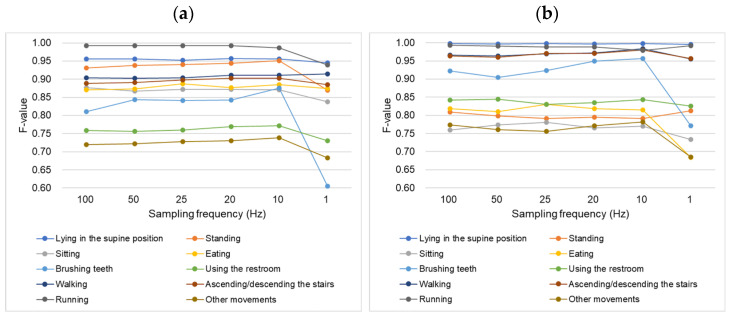
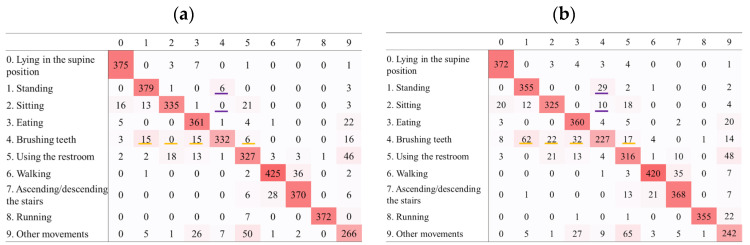
Human activity recognition using wearable accelerometer data can be a useful digital biomarker for severity assessment and the diagnosis of diseases, where the relationship between onset and patient activity is crucial. For long-term monitoring in clinical settings, the volume of data collected over time should be minimized to reduce power consumption, computational load, and communication volume. This study aimed to determine the lowest sampling frequency that maintains recognition accuracy for each activity. Thirty healthy participants wore nine-axis accelerometer sensors at five body locations and performed nine activities. Machine-learning-based activity recognition was conducted using data sampled at 100, 50, 25, 20, 10, and 1 Hz. Data from the non-dominant wrist and chest, which have previously shown high recognition accuracy, were used. Reducing the sampling frequency to 10 Hz did not significantly affect the recognition accuracy for either location. However, lowering the frequency to 1 Hz decreases the accuracy of many activities, particularly brushing teeth. Using data with a 10 Hz sampling frequency can maintain recognition accuracy while decreasing data volume, enabling long-term patient monitoring and device miniaturization for clinical applications.
Keywords: digital biomarkers; digital health; human activity recognition; machine learning; sampling frequency; wearable devices.
Conflict of interest statement
The authors declare no conflicts of interest.
Figures
Similar articles
-
Generalizable machine learning for stress monitoring from wearable devices: A systematic literature review.Int J Med Inform. 2023 May;173:105026. doi: 10.1016/j.ijmedinf.2023.105026. Epub 2023 Feb 28. Int J Med Inform. 2023. PMID: 36893657
-
Antiretrovirals for reducing the risk of mother-to-child transmission of HIV infection.Cochrane Database Syst Rev. 2011 Jul 6;(7):CD003510. doi: 10.1002/14651858.CD003510.pub3. Cochrane Database Syst Rev. 2011. PMID: 21735394
-
Systemic pharmacological treatments for chronic plaque psoriasis: a network meta-analysis.Cochrane Database Syst Rev. 2021 Apr 19;4(4):CD011535. doi: 10.1002/14651858.CD011535.pub4. Cochrane Database Syst Rev. 2021. Update in: Cochrane Database Syst Rev. 2022 May 23;5:CD011535. doi: 10.1002/14651858.CD011535.pub5. PMID: 33871055 Free PMC article. Updated.
-
Rapid, point-of-care antigen tests for diagnosis of SARS-CoV-2 infection.Cochrane Database Syst Rev. 2022 Jul 22;7(7):CD013705. doi: 10.1002/14651858.CD013705.pub3. Cochrane Database Syst Rev. 2022. PMID: 35866452 Free PMC article.
-
Development of prediction models for screening depression and anxiety using smartphone and wearable-based digital phenotyping: protocol for the Smartphone and Wearable Assessment for Real-Time Screening of Depression and Anxiety (SWARTS-DA) observational study in Korea.BMJ Open. 2025 Jun 20;15(6):e096773. doi: 10.1136/bmjopen-2024-096773. BMJ Open. 2025. PMID: 40541438 Free PMC article.
References
-
- Yousaf R., Arif M., Ullah Q., Rafique S., Hanif A., Ali M. Daily Activity Related Quality of Life in Chronic Obstructive Pulmonary Disease in Adults. Int. J. Front. Sci. 2019;3:10–23. doi: 10.37978/tijfs.v3i1.44. - DOI
-
- Yamane T., Kimura M., Morita M. Application of Nine-Axis Accelerometer-Based Recognition of Daily Activities in Clinical Examination. Phys. Act. Health. 2024;8:29–46. doi: 10.5334/paah.313. - DOI
MeSH terms
Grants and funding
LinkOut - more resources
Full Text Sources
