

NDVI and Beyond: Vegetation Indices as Features for Crop Recognition and Segmentation in Hyperspectral Data
- PMID: 40573704
- PMCID: PMC12196755
- DOI: 10.3390/s25123817
NDVI and Beyond: Vegetation Indices as Features for Crop Recognition and Segmentation in Hyperspectral Data
Abstract
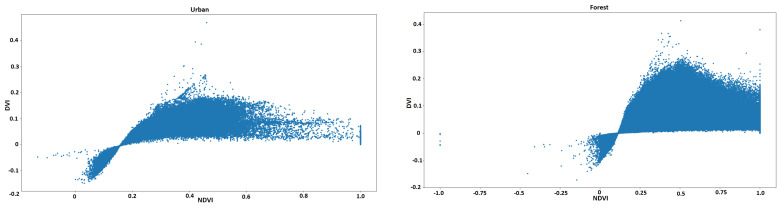
Vegetation indices have long been central to vegetation monitoring through remote sensing. The most popular one is the Normalized Difference Vegetation Index (NDVI), yet many vegetation indices (VIs) exist. In this paper, we investigate their distinctiveness and discriminative power in the context of applications for agriculture based on hyperspectral data. More precisely, this paper merges two complementary perspectives: an unsupervised analysis with PRISMA satellite imagery to explore whether these indices are truly distinct in practice and a supervised classification over UAV hyperspectral data. We assess their discriminative power, statistical correlations, and perceptual similarities. Our findings suggest that while many VIs have a certain correlation with the NDVI, meaningful differences emerge depending on landscape and application context, thus supporting their effectiveness as discriminative features usable in remote crop segmentation and recognition applications.
Keywords: NDVI; classification; hyperspectral imaging; remote sensing; similarity metrics; vegetation indices.
Conflict of interest statement
The authors declare no conflicts of interest.
Figures


Similar articles
-
Characterization of Hazelnut Trees in Open Field Through High-Resolution UAV-Based Imagery and Vegetation Indices.Sensors (Basel). 2025 Jan 6;25(1):288. doi: 10.3390/s25010288. Sensors (Basel). 2025. PMID: 39797079 Free PMC article.
-
Research on Crop Classification Using U-Net Integrated with Multimodal Remote Sensing Temporal Features.Sensors (Basel). 2025 Aug 13;25(16):5005. doi: 10.3390/s25165005. Sensors (Basel). 2025. PMID: 40871869 Free PMC article.
-
Is Antarctica Greening?Glob Chang Biol. 2025 Jun;31(6):e70294. doi: 10.1111/gcb.70294. Glob Chang Biol. 2025. PMID: 40539270 Review.
-
Systemic pharmacological treatments for chronic plaque psoriasis: a network meta-analysis.Cochrane Database Syst Rev. 2021 Apr 19;4(4):CD011535. doi: 10.1002/14651858.CD011535.pub4. Cochrane Database Syst Rev. 2021. Update in: Cochrane Database Syst Rev. 2022 May 23;5:CD011535. doi: 10.1002/14651858.CD011535.pub5. PMID: 33871055 Free PMC article. Updated.
-
The use of Open Dialogue in Trauma Informed Care services for mental health consumers and their family networks: A scoping review.J Psychiatr Ment Health Nurs. 2024 Aug;31(4):681-698. doi: 10.1111/jpm.13023. Epub 2024 Jan 17. J Psychiatr Ment Health Nurs. 2024. PMID: 38230967
References
-
- Weiss M., Jacob F., Duveiller G. Remote sensing for agricultural applications: A meta-review. Remote Sens. Environ. 2020;236:111402. doi: 10.1016/j.rse.2019.111402. - DOI
-
- Sishodia R.P., Ray R.L., Singh S.K. Applications of remote sensing in precision agriculture: A review. Remote Sens. 2020;12:3136. doi: 10.3390/rs12193136. - DOI
-
- Vidican R., Mălinaș A., Ranta O., Moldovan C., Marian O., Ghețe A., Ghișe C.R., Popovici F., Cătunescu G.M. Using remote sensing vegetation indices for the discrimination and monitoring of agricultural crops: A critical review. Agronomy. 2023;13:3040. doi: 10.3390/agronomy13123040. - DOI
-
- Ivanovici M., Olteanu G., Florea C., Coliban R.M., Ștefan M., Marandskiy K. Digital Transformation: Exploring the Impact of Digital Transformation on Organizational Processes. Springer; Berlin/Heidelberg, Germany: 2024. Digital Transformation in Agriculture; pp. 157–191.
-
- Tucker C.J. Red and photographic infrared linear combinations for monitoring vegetation. Remote Sens. Environ. 1979;8:127–150. doi: 10.1016/0034-4257(79)90013-0. - DOI
MeSH terms
Grants and funding
LinkOut - more resources
Full Text Sources
