

Selection and Validation of Reference Genes for RT-qPCR in Protonemal Tissue of the Desiccation-Tolerant Moss Pseudocrossidium replicatum Under Multiple Abiotic Stress Conditions
- PMID: 40573739
- PMCID: PMC12197192
- DOI: 10.3390/plants14121752
Selection and Validation of Reference Genes for RT-qPCR in Protonemal Tissue of the Desiccation-Tolerant Moss Pseudocrossidium replicatum Under Multiple Abiotic Stress Conditions
Abstract
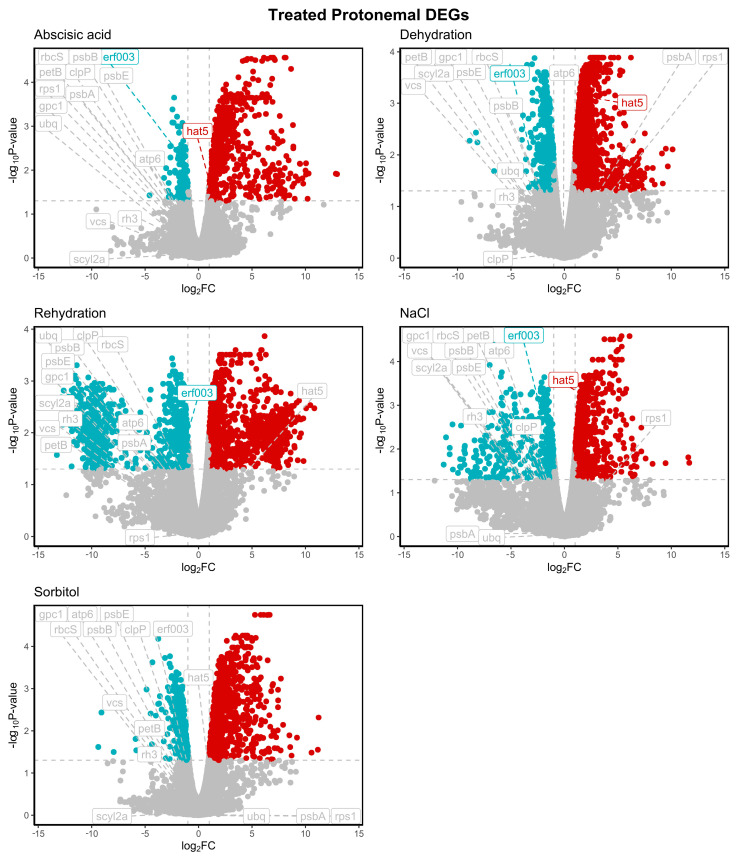
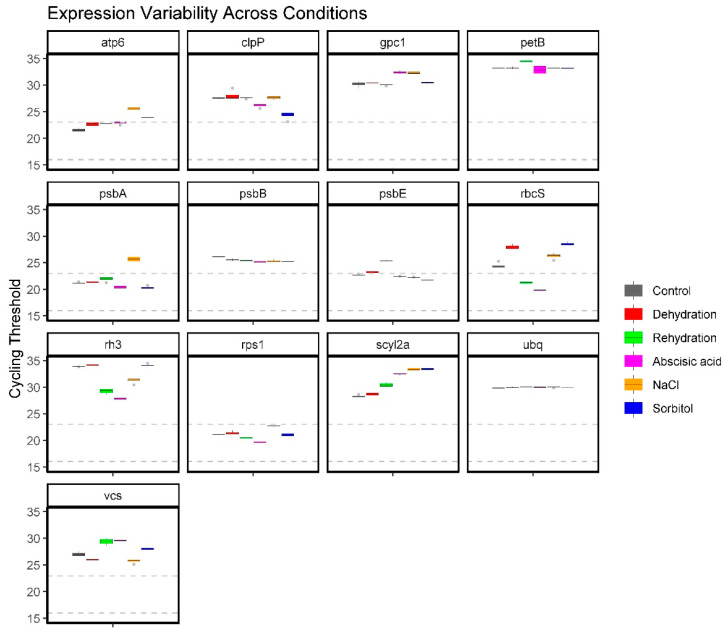
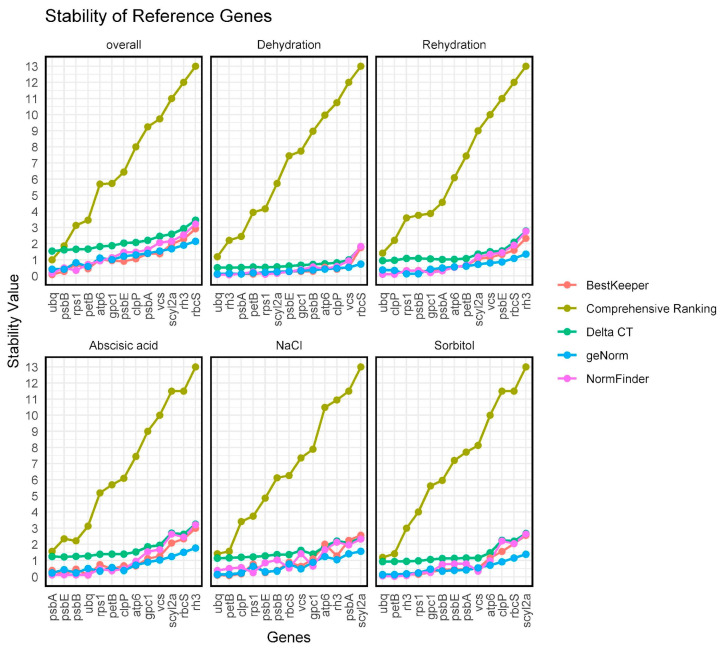
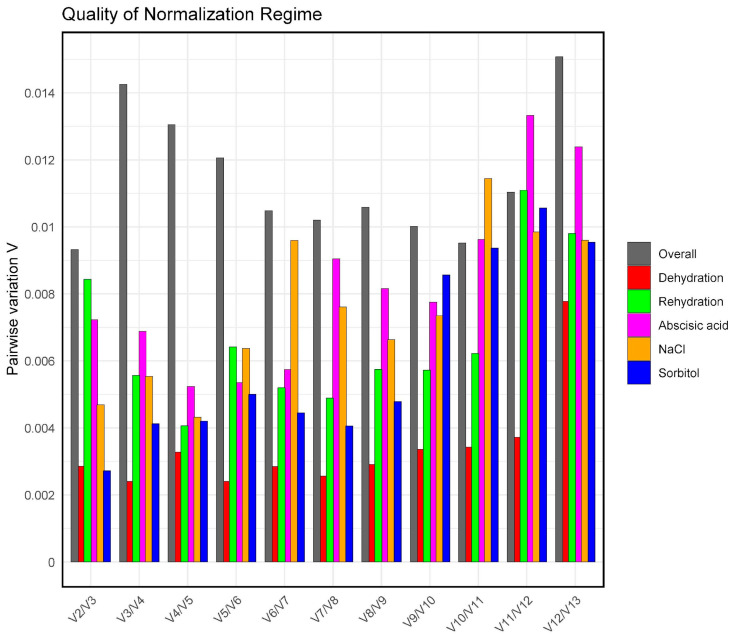
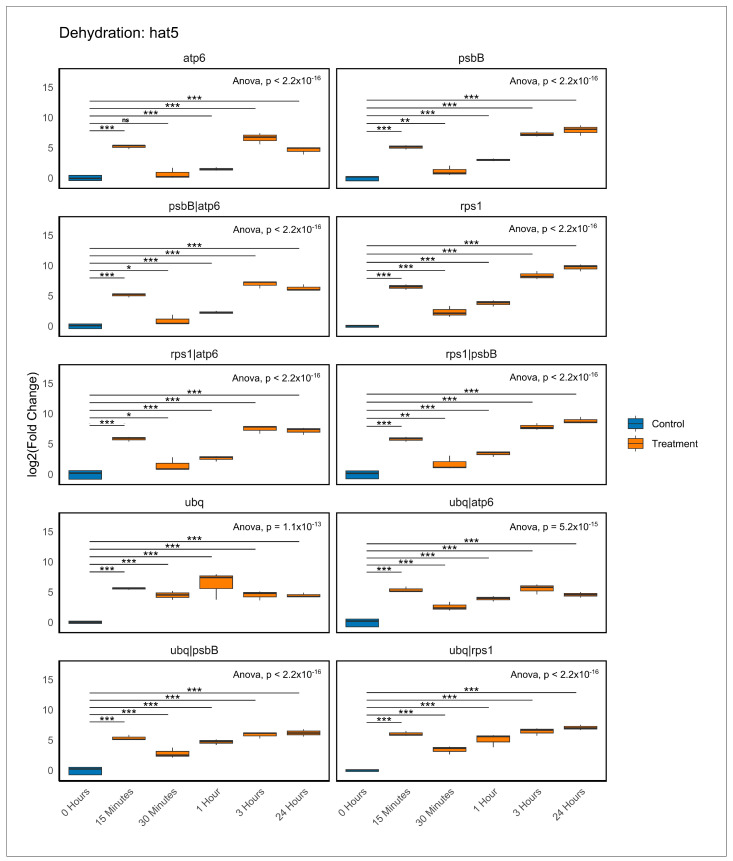
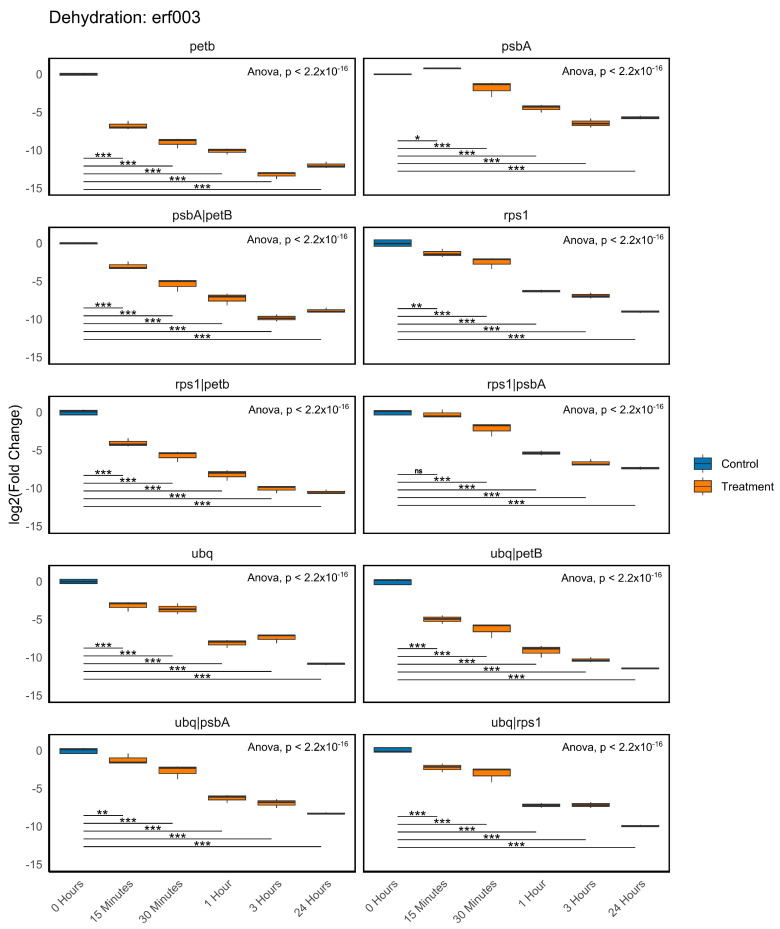
Plant abiotic stresses are the main cause of significant crop losses worldwide. The moss Pseudocrossidium replicatum is highly tolerant to different types of abiotic stress, such as desiccation. Our group is interested in identifying and characterising differentially expressed genes in response to abiotic stress in this species. However, a collection of validated reference genes for RT-qPCR analysis is essential to normalise the expression of genes in response to the conditions of interest. Here, we assessed 13 candidate reference genes for P. replicatum based on their expression stability across transcriptomes from six abiotic stress-related conditions using the RefFinder, BestKeeper, geNorm, and NormFinder programs. The stability and reliability of the proposed reference genes were evaluated under six experimental conditions: control, dehydration, rehydration, abscisic acid (ABA), NaCl, and sorbitol. Interestingly, most proposed reference genes exhibited high stability (low M values) across all analysed abiotic stress conditions. A pairwise variation analysis indicated that only one pair is necessary to normalise RT-qPCR experiments. Each gene was confirmed to normalise the expression of both upregulated and downregulated genes. This represents the first report of validated reference genes for RT-qPCR gene expression studies under abiotic stress in the protonemal tissue of a fully desiccation-tolerant moss.
Keywords: ABA; Pseudocrossidium replicatum; RT-qPCR; abiotic stress; bryophytes; desiccation; osmotic stress; reference genes; salinity; transcriptome.
Conflict of interest statement
The authors declare that the research was conducted in the absence of any commercial or financial relationships that could be construed as a potential conflict of interest.
Figures
Similar articles
-
Pseudocrossidium replicatum (Taylor) R.H. Zander is a fully desiccation-tolerant moss that expresses an inducible molecular mechanism in response to severe abiotic stress.Plant Mol Biol. 2021 Nov;107(4-5):387-404. doi: 10.1007/s11103-021-01167-3. Epub 2021 Jun 29. Plant Mol Biol. 2021. PMID: 34189708 Free PMC article.
-
Signs and symptoms to determine if a patient presenting in primary care or hospital outpatient settings has COVID-19.Cochrane Database Syst Rev. 2022 May 20;5(5):CD013665. doi: 10.1002/14651858.CD013665.pub3. Cochrane Database Syst Rev. 2022. PMID: 35593186 Free PMC article.
-
Selection and validation of reference genes for RT-qPCR analysis of the Longan psyllid Cornegenapsylla sinica (Hemiptera: Psyllidae).Environ Entomol. 2025 Jun 19:nvaf059. doi: 10.1093/ee/nvaf059. Online ahead of print. Environ Entomol. 2025. PMID: 40578322
-
Validation of reference genes for RT-qPCR in marine bivalve ecotoxicology: Systematic review and case study using copper treated primary Ruditapes philippinarum hemocytes.Aquat Toxicol. 2017 Apr;185:86-94. doi: 10.1016/j.aquatox.2017.01.003. Epub 2017 Jan 16. Aquat Toxicol. 2017. PMID: 28189915
-
Drugs for preventing postoperative nausea and vomiting in adults after general anaesthesia: a network meta-analysis.Cochrane Database Syst Rev. 2020 Oct 19;10(10):CD012859. doi: 10.1002/14651858.CD012859.pub2. Cochrane Database Syst Rev. 2020. PMID: 33075160 Free PMC article.
References
-
- Walter V.R. Ecosystems and Human Well-Being: Synthesis. Island Press; Washington, DC, USA: 2005. [(accessed on 23 March 2025)]. Available online: www.millenniumassessment.org/documents/document.356.aspx.pdf.
-
- The State of Food and Agriculture 2023. FAO; Rome, Italy: 2023. - DOI
Grants and funding
LinkOut - more resources
Full Text Sources
