

Optimizing Management of Alfalfa (Medicago sativa L.) Nitrogen Fertilizer Based on Critical Nitrogen Concentration Dilution Curve Model
- PMID: 40573770
- PMCID: PMC12196858
- DOI: 10.3390/plants14121782
Optimizing Management of Alfalfa (Medicago sativa L.) Nitrogen Fertilizer Based on Critical Nitrogen Concentration Dilution Curve Model
Abstract
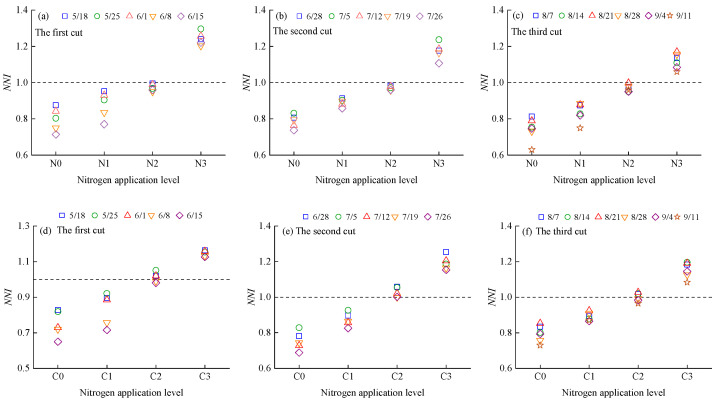
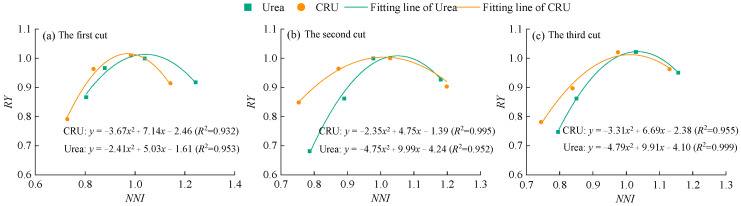
The critical nitrogen dilution curve (CNDC) model enables precise nitrogen management by quantifying the threshold of nitrogen deficiency in crops, thereby enhancing both crop productivity and nitrogen use efficiency. However, its applicability to perennial crops remains unclear. In this study, alfalfa (Medicago sativa L.), a perennial leguminous forage, was used as the model crop. Based on two years of field experiments, CNDC models of aboveground biomass were constructed under two nitrogen fertilizer regimes: urea (0, 80, 160, and 240 kg·ha-1, applied in a 6:2:2 basal-to-topdressing ratio) and controlled-release urea (CRU; 0, 80, 160, and 240 kg·ha-1, applied as a single basal dose). Using these models, the nitrogen nutrition index (NNI) and cumulative nitrogen deficit (Nand) models were developed to diagnose alfalfa nitrogen status, and the optimal nitrogen application rates were determined via regression analysis. The results showed that critical nitrogen concentration and aboveground biomass followed a power function relationship under both fertilizer types. For CRU treatments, parameters a and b were 3.41 and 0.20 (first cut), 3.15 and 0.12 (second cut), and 2.24 and 0.40 (third cut), respectively. For urea treatments, a and b were 3.13 and 0.35 (first cut), 2.21 and 0.16 (second cut), and 1.75 and 0.73 (third cut). The normalized root mean square error (n-RMSE) of the models ranged from 3.1% to 13%, indicating high model reliability. Based on the NNI, Nand, and yield response models, the optimal nitrogen application rates were 175.44~181.71 kg·ha-1 for urea and 145.63~153.46 kg·ha-1 for CRU, corresponding to theoretical maximum yields of 14.76~17.40 t·ha-1 and 16.76~20.66 t·ha-1, respectively. Compared to urea, CRU reduced nitrogen input by 18.41~20.47% while achieving equivalent or higher theoretical yields. This study provides a scientific basis for nitrogen status diagnosis and precision nitrogen application in alfalfa cultivation.
Keywords: alfalfa; critical nitrogen concentration; nitrogen application rates; nitrogen nutrition diagnostics.
Conflict of interest statement
The authors declare no conflicts of interest.
Figures


Similar articles
-
Species Interactions Shape Nitrogen Utilization Characteristics and Influence Soil Quality in Jujube-Alfalfa Intercropping System.Plants (Basel). 2025 Jul 3;14(13):2048. doi: 10.3390/plants14132048. Plants (Basel). 2025. PMID: 40648057 Free PMC article.
-
Optimizing nutrient management protocol for Ophiopogon japonicus-corn intercropping: impacts on growth, yield, and medicinal quality.PeerJ. 2025 Jul 14;13:e19655. doi: 10.7717/peerj.19655. eCollection 2025. PeerJ. 2025. PMID: 40677750 Free PMC article.
-
Effects of subsurface drip irrigation and nitrogen fertilizer management on N2O emissions and forage yield in alfalfa production.Front Plant Sci. 2025 Jun 3;16:1598110. doi: 10.3389/fpls.2025.1598110. eCollection 2025. Front Plant Sci. 2025. PMID: 40530270 Free PMC article.
-
Eliciting adverse effects data from participants in clinical trials.Cochrane Database Syst Rev. 2018 Jan 16;1(1):MR000039. doi: 10.1002/14651858.MR000039.pub2. Cochrane Database Syst Rev. 2018. PMID: 29372930 Free PMC article.
-
Intravenous magnesium sulphate and sotalol for prevention of atrial fibrillation after coronary artery bypass surgery: a systematic review and economic evaluation.Health Technol Assess. 2008 Jun;12(28):iii-iv, ix-95. doi: 10.3310/hta12280. Health Technol Assess. 2008. PMID: 18547499
References
-
- Wang S.S., Ye H.H., Yang C.F., Zhang Y., Pu J.W., Ren Y.H., Xie K., Wang L.X., Zeng D.C., He H.Q., et al. OsNLP3 and OsPHR2 orchestrate direct and mycorrhizal pathways for nitrate uptake by regulating NAR2.1-NRTs complexes in rice. Proc. Natl. Acad. Sci. USA. 2025;122:e2416345122. doi: 10.1073/pnas.2416345122. - DOI - PMC - PubMed
-
- Zhang Q.Z., Hao G., Li H.Y. Effects of availability and form of exogenous nitrogen on plant growth and physiology: Progress and prospects. Chin. J. Ecol. 2024;43:878–887. (In Chinese)
-
- Tyagi J., Ahmad S., Malik M. Nitrogenous fertilizers: Impact on environment sustainability, mitigation strategies, and challenges. Int. J. Environ. Sci. Technol. 2022;19:49–72. doi: 10.1007/s13762-022-04027-9. - DOI
Grants and funding
- Grant Nos. 52069001 and 52269009/National Natural Science Regional Foundation of China
- Grant No. Gaufx-05Y11/Gansu Agricultural University, the fifth batch of "Fuxi Young Talents" project
- Grant No. GAU-QDFC-2023-12/Gansu Agricultural University, the Youth Tutor Support Fund
- Grant No. GAU-XKTD-2022-09/the Gansu Agricultural University "Innovation of Efficient Utilization of Soil and Water Re-sources for Specialty Crops in Northwest Arid Regions" Discipline Team Building Special Pro-ject
LinkOut - more resources
Full Text Sources
Research Materials
