. 2025 Jun 11;14(12):1796.
doi: 10.3390/plants14121796.

What Is the Potential of Daphnia (Water Flea) Predation as a Means of Biological Suppression of Prymnesium parvum (Golden Algae) Blooms in Ecologically Relevant Conditions?

Affiliations

What Is the Potential of Daphnia (Water Flea) Predation as a Means of Biological Suppression of Prymnesium parvum (Golden Algae) Blooms in Ecologically Relevant Conditions?

Marta Galas et al. Plants (Basel). .

Abstract

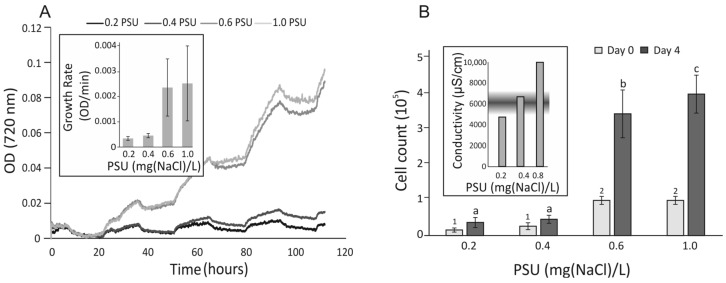
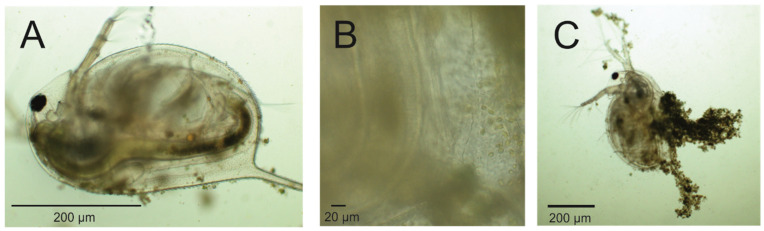
This study explores the interaction between Prymnesium parvum and Daphnia magna under low-salinity conditions. P. parvum showed reduced growth below 0.4 PSU and peaked at 1.0 PSU within the tested 0.2-1.0 PSU range. D. magna, exposed to P. parvum across 0.0-6.0 PSU, experienced increased mortality at 4.0 and 6.0 PSU, but tolerated 0.0-1.0 PSU well and grazed actively on P. parvum without significant vitality loss. This range reflects conditions observed in the Oder River during the 2022 fish die-off. The count of P. parvum cells did not vary significantly across the 0.2 to 1.0 PSU range of salinities in D. magna presence, except at 0.6 PSU. All daphnids survived even at P. parvum densities of 1 × 10⁵ cells/mL, though increasing algal concentrations reduced juvenile growth rates. Direct observation under a microscope confirmed algal ingestion. Toxin accumulation in cells and medium likely reduced grazing efficiency via allelopathic effects. The study assessed whether D. magna can tolerate prymnesins while maintaining feeding under varying salinities. Results suggest that Daphnia magna could act as a biological suppressor of golden algae under certain environmental conditions, though further work is needed to quantify grazing efficiency and prymnesins concentrations.

Keywords: Daphnia magna; Prymnesium parvum; harmful algae blooms (HABs).


Conflict of interest statement

The authors declare no conflict of interest.

Figures

Figure 1
Figure 1
Growth curves of Prymnesium parvum cells under selected salinity conditions. (Panel (A)) Cell growth was continuously monitored in duplicate cultures across a salinity range of 0.2–1.0 PSU. (Inset (A)) Growth rates were calculated as the mean increase in cell density during the light phase. (Panel (B)) Cell counts were recorded before and after cultivation. Mean values are shown, and statistical analysis was performed using ANOVA followed by Tukey’s post hoc test in R. Statistically significant differences were annotated in groups with different low-case letters at the end of experiment and numbers at the beginning of the experiment. (Inset (B)) Conductivity values corresponding to the tested salinity range are shown, with the shaded area indicating the range associated with mass fish kill (MFK) events in the Oder River.
Figure 2
Figure 2
The figure represents Daphnia’s mortality (solid bars) and ephippia production (hatched bars) at three time points (24, 48 and 72 h) under different salt concentrations ranging within 0.0–6.0 PSU (g/L). Mortality and ephippia production are presented as percentages [%] of the total number of daphnids (9 individuals) in each variant.
Figure 3
Figure 3
Difference between Prymnesium parvum cell count at the start and after 72 h in the presence of Daphnia magna. At the beginning of the experiment, the cell number of P. parvum used as the sole food source for daphnids was measured and adjusted to fulfill the non-limiting concentration of total organic carbon (TOC), which is 1 mg L−1. The evaluation of cell number showed that 1 mg TOC concentration is equal to 1.25 × 10⁴ cells/mL of P. parvum cells. For each variant, we used the same number of cells at the beginning and checked the cell number of P. parvum after 72 h of presence to filter feeding D. magna in different salinity concentrations. Change in cell number within that time is represented as boxplot. In each box, a central bold line represents the median. Whiskers in every box stand for minimal and maximal values. Asterisk indicate statistically significant difference between variants with different salinity in comparison to the control (1.0 PSU) (p < 0.01, one-way ANOVA and post hoc Tukey HSD). Each box represents P. parvum cells in the presence of D. magna at different salinity levels; white box—0.0 PSU, light gray—0.2 PSU, gray—0.4 PSU, dark gray—0.6 PSU, the darkest gray—0.8 PSU, and the black one—1.0 PSU, used as a control in this study.
Figure 4
Figure 4
Change in growth rate of D. magna caused by Prymnesium parvum influence as a nutrition source. Three neonates, previously adapted to salt concentration of 1 g L−1, were used in the study, with three replicates per variant, resulting in nine individuals per variant. The study was conducted at a salinity of 1.0 PSU. P. parvum was provided as the sole food source for the neonates, with concentrations of 1.0 mg (light gray box), 2.0 mg (gray box), 4.0 mg (dark gray box), and 6.0 mg total organic carbon (TOC) per liter (darkest gray box). As the control, neonates were fed green algae Acutodesmus obliquus at a concentration of 1.0 mg TOC per liter, representing the minimal non-limiting growth concentration (white box). The evaluation of TOC concentration indicates that for P. parvum, 1 mg TOC is equal to 1.25 × 10⁴ cells/mL, and for A. obliquus, 1 mg TOC is represented by 9.85 × 10⁵ of cells/mL. The boxplot shows the growth rates over time. The bold central line in each box represents the median value, while the whiskers indicate the minimum and maximum values. Outliers are marked as circular points. Stars indicate statistically significant differences between variants with P. parvum as the food source compared to the control (p < 0.001), based on the non-parametric Kruskal–Wallis test and post hoc Tukey HSD.
Figure 5
Figure 5
Interaction between Daphnia magna and Prymnesium parvum cells observed with an optical microscope. Daphnia magna was collected from suspension with 6 mg TOC per liter, which is equal to a density of 7.51 × 10⁴ cell/mL of P. parvum. The feeding behavior (i.e., rhythmic movements of the thoracic appendages) of the Daphnia specimen was observed under a microscope (Nexcope NE620). The presence of Prymnesium parvum cells within the gut of the specimen was confirmed (A,B), although an aggregation of algal cells around daphniid, resulting in reduced mobility, was also observed (C).

Similar articles

References

    1. Free G., Van De Bund W., Gawlik B., Van Wijk L., Wood M., Guagnini E., Koutelos K., Annunziato A., Grizzetti B., Vigiak O., et al. An EU Analysis of the Ecological Disaster in the Oder River of 2022 (JRC132271) Publications Office of the European Union; Luxembourg: 2023. - DOI
    1. Köhler J., Varga E., Spahr S., Gessner J., Stelzer K., Brandt G., Mahecha M.D., Kraemer G., Pusch M., Wolter C., et al. Unpredicted ecosystem response to compound human impacts in a European river. Sci. Rep. 2024;14:16445. doi: 10.1038/s41598-024-66943-9. - DOI - PMC - PubMed
    1. Umphres G.D., Roelke D.L., Netherland M.D. A chemical approach for the mitigation of Prymnesium parvum blooms. Toxicon. 2012;60:1235–1244. doi: 10.1016/j.toxicon.2012.08.006. - DOI - PubMed
    1. Serra T., Soler M., Pous N., Colomer J. Daphnia magna filtration, swimming and mortality under ammonium, nitrite, nitrate and phosphate. Sci. Total Environ. 2019;656:331–337. doi: 10.1016/j.scitotenv.2018.11.382. - DOI - PubMed
    1. Ebert D. Daphnia as a versatile model system in ecology and evolution. EvoDevo. 2022;13:16. doi: 10.1186/s13227-022-00199-0. - DOI - PMC - PubMed

LinkOut - more resources