. 2025 Jun 12;14(12):1802.
doi: 10.3390/plants14121802.

Cesium Accumulation Patterns and Stress Response in Hydroponic Radish (Raphanus sativus L.): A Physiological-Transcriptomic Study

Affiliations

Cesium Accumulation Patterns and Stress Response in Hydroponic Radish (Raphanus sativus L.): A Physiological-Transcriptomic Study

Yu-Han Wen et al. Plants (Basel). .

Abstract

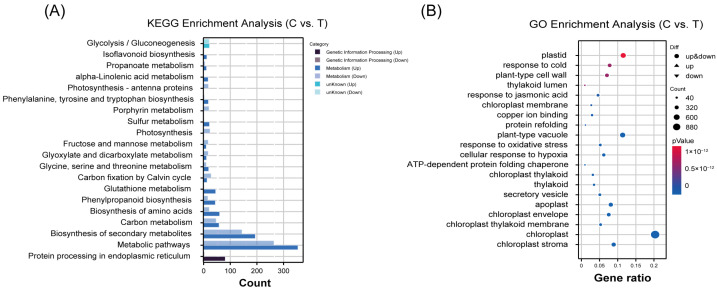
The present study systematically investigated the cesium (Cs) enrichment characteristics and physiological responses to Cs exposure in radish (Raphanus sativus L.) seedlings under hydroponic conditions through integrated physiological, biochemical, and transcriptome analyses. The results showed that the Cs content in radish roots, stems, and cotyledons increased progressively with rising Cs concentrations (0.25-2 mM), and Cs mainly accumulated in the cotyledon. The transfer factor (TF) increased by 63.29% (TF = 3.87) as the Cs concentration increased from 0.25 to 2 mM, while the biological concentration factor (BCF) decreased by 72.56% (BCF = 14.87). Severe growth inhibition was observed at 2 mM Cs stress, with biomass reduction reaching 29.73%. The carotenoid content decreased by 11.92%; however, the total chlorophyll content did not change significantly, and the photosynthesis of radish was not affected. In addition, Cs exposure disrupted mineral nutrient homeostasis, decreasing potassium (K), sodium (Na), magnesium (Mg), and iron (Fe) content. The superoxide dismutase (SOD), peroxidase (POD), and catalase (CAT) activities, reactive oxygen species (ROS), and malondialdehyde (MDA) content increased under the different Cs treatments, which indicated that Cs exposure induced oxidative stress response in radish seedlings. Transcriptome analysis detected a total of 4326 differentially expressed genes (DEGs), in which altered expression patterns in genes associated with mineral transport, antioxidant systems, and carotenoid biosynthesis pathways in radish under 2 mM Cs treatment were observed. In conclusion, this study comprehensively investigated the physiological and molecular responses of radish to Cs stress, revealing that Cs accumulation exhibited site-specific preference and concentration dependence and induced physiological disturbances, including growth inhibition and photosynthetic pigment metabolism alterations. At the transcription level, Cs activated the enzymatic antioxidant system, related genes, and stress-response pathways. Notably, this study is the first to demonstrate that Cs disrupts plant mineral nutrition homeostasis and inhibits carotenoid biosynthesis. These findings establish a crucial theoretical foundation for utilizing radish in Cs-contaminated phytoremediation strategies.

Keywords: antioxidant; cesium; mineral elements; photosynthesis; reactive oxygen species.


Conflict of interest statement

All authors declare that we have no significant competing financial or professional interests that might have affected the work and presentation described in this manuscript.

Figures

Figure 1
Figure 1
The growth of radish seedlings under different Cs exposure. (A) Phenotype of radish seedlings under Cs stress. Cs concentrations were 0, 0.25, 0.5, 1, 1.5, and 2 mM. (BD) Cs reduced the biomass of radish seedlings’ roots, stems, and cotyledons. Different lowercase letters represent significant differences (p < 0.05) in treatment groups (n = 6).
Figure 2
Figure 2
The enrichment characteristics of radish seedlings under different Cs treatments. (AC) Cs accumulation in the root, stem, and cotyledon of radish seedlings. (D) The BCF and TF of Cs in radish seedlings. BCF indicates biological concentration factor, and TF indicates transfer factor. Different lowercase letters represent significant differences (p < 0.05) between the treatment groups (n = 6); nd means not detected.
Figure 3
Figure 3
Cs affected photosynthetic gas exchange in the radish seedlings’ cotyledons. (AD) Photosynthetic gas exchange parameters. Pn: net photosynthetic rate, Tr: transpiration rate, Ci: intercellular CO2 concentration, Gs: stomatal conductance. Different lowercase letters represent significant differences (p < 0.05) in treatment groups (n = 6).
Figure 4
Figure 4
Cs affected chlorophyll fluorescence in the radish seedlings’ cotyledons. (AC) Cs affected the pigment content of radish seedlings. Chl a: chlorophyll a, Chl b: chlorophyll b, Car.: carotenoid. (D–I) Chlorophyll fluorescence parameters. Fv/Fm: maximum photochemical efficiency, Fv’/Fm’: capture efficiency of excitation energy, ΦPSII: actual photochemical efficiency, ETR: electron transfer rate, qP: photochemical quenching coefficient, NPQ: non-photochemical quenching coefficient. Different lowercase letters represent significant differences (p < 0.05) in treatment groups (n = 6).
Figure 5
Figure 5
Cs disturbed mineral nutrient homeostasis in radish seedlings. (AF) The K, Na, Ca, Mg, Mn, and Fe contents under different Cs exposures. * and ** represent significant differences in different treatment groups and the control at the 0.05 and 0.01 levels (n = 6).
Figure 6
Figure 6
Cs disturbed ROS homeostasis in radish seedlings. (A) H2O2 and O2 staining with DAB/NBT. (B) SOD activities. (C) POD activities. (D) CAT activities. (E) Malondialdehyde (MDA) contents. (F) O2 content. (G) H2O2 content. The different lowercase letters represent significant differences (p < 0.05) in treatment groups (n = 6).
Figure 7
Figure 7
Annotation of transcriptome data and analysis of gene expression patterns in radish seedlings’ cotyledons under 2 mM Cs treatment. (A) Principal component analysis (PCA) plot. (B) Volcano map of DEGs. (C) Annotation degree of DEGs. (D) Correlation Analysis of qRT-PCR and RNA-seq; red area indicates 95% confidence intervals. (E) Heat map Analysis. C1–C3 indicate the control group, T1–T3 indicate the 2 mM Cs treatment group (n = 3). Red represents up-regulated genes; blue represents down-regulated genes (n = 3).
Figure 8
Figure 8
KEGG and GO enrichment analysis of radish seedlings’ cotyledons after 48 h of 2 mM Cs treatment. (A) Gene Ontology (GO) enrichment analysis of DEGs. The abscissa represents the proportion of the genes in the corresponding entry in all the genes in that entry, and the ordinate represents the different gene function entries. Circle size represents enrichment in the corresponding bar. Color represents enrichment significance, and circles indicate that the gene function is associated with both up-regulated genes and down-regulated genes. (B) Kyoto Encyclopedia of Genes and Genomes (KEGG) enrichment analysis of DEGs. The abscissa represents the pathway names, and the ordinate is the number of enriched genes (n = 3).
Figure 9
Figure 9
Visual analysis of genes involved in mineral elements absorption (A), antioxidant system (B), and carotenoid biosynthesis (C) in radish seedlings after 48 h of Cs exposure. Legend number indicates the number of genes. GPX: glutathione peroxidase, APX: ascorbate peroxidase, DHAR: dehydroascorbate reductase, MADHAR: monodehydroascorbate reductase (MDHAR), DHA: docosahexaenoic acid, AsA: L-ascorbic acid, IPP: isopentenyl pyrophosphate, IPI: isopentenyl diphosphate isomerase, GGPPS: two-geranyl pyrophosphate synthetase, GGPP: two-geranylgeranyl diphosphate, PSY: phytoene synthase, PDS: phytoene desaturase, Z-ISO: ζ-carotene isomerase, ZDS: ζ-carotene desaturase, CRTISO: carotenoid isomerase, LCY-α: lycopene α-cyclase, LCY-β: lycopene β-cyclase, CHY-β: β-ring hydroxylase, CHY-ε: ε-ring hydroxylase, ZEP: zeaxanthin epoxidase, VDE: violaxanthin de-epoxidase, NSY: neoxanthin synthase, NCED: 9-cis-epoxycarotenoid dioxygenase. In the pie chart, red represents up-regulated genes, blue represents down-regulated genes, and gray represents no significant difference for this gene. The figures were mapped based on the following KEGG metabolic pathways/GO term: GO: 0016209 (antioxidant activity), ko00906 (Carotenoid biosynthesis) (n = 3).
Figure 10
Figure 10
Effects of Cs stress on the antioxidant enzyme-associated gene expression in radish seedlings. (A) CSD1 (copper/zinc superoxide dismutase 1) relative expression under Cs stress, (B) FSD1 (iron superoxide dismutase 1) relative expression under Cs stress, (C) FSD2 (iron superoxide dismutase 2) relative expression under Cs stress, (D) MSD1 (manganese superoxide dismutase 1) relative expression under Cs stress, (E) CAT1 (catalase 1) relative expression under Cs stress, (F) CAT2 (catalase 2) relative expression under Cs stress, (G) CAT3 (catalase 3) relative expression under Cs stress, (H) POD34 (peroxidase 34) relative expression under Cs stress, (I) POD47 (peroxidase 48) relative expression under Cs stress, (J) POD58 (peroxidase 58) relative expression under Cs stress. * and ** represent significant differences in different treatment groups and the control at the 0.05 and 0.01 levels (n = 3).

References

    1. Zhu Y.G., Smolders E. Plant uptake of radiocaesium: A review of mechanisms, regulation and application. J. Exp. Bot. 2000;51:1635–1645. doi: 10.1093/jexbot/51.351.1635. - DOI - PubMed
    1. Wei F., Chen J., Wu Y., Zheng C. Research on the background values of the Chinese soil environment. Environ. Sci. 1991;12:5–19. doi: 10.13227/j.hjkx.1991.04.005. - DOI
    1. Ammar A., Nouira A., El Mouridi Z., Boughribil S. Recent trends in the phytoremediation of radionuclide contamination of soil by cesium and strontium: Sources, mechanisms and methods: A comprehensive review. Chemosphere. 2024;359:142273. doi: 10.1016/j.chemosphere.2024.142273. - DOI - PubMed
    1. Ashraf M.A., Akib S., Maah M.J., Yusoff I., Balkhair K.S. Cesium-137: Radio-Chemistry, Fate, and Transport, Remediation, and Future Concerns. Crit. Rev. Environ. Sci. Technol. 2014;44:1740–1793. doi: 10.1080/10643389.2013.790753. - DOI
    1. Liu J., Zhao L., Liu Q., Li J., Qiao Z., Sun P., Yang Y. A critical review on soil washing during soil remediation for heavy metals and organic pollutants. Int. J. Environ. Sci. Technol. 2021;19:601–624. doi: 10.1007/s13762-021-03144-1. - DOI

LinkOut - more resources