Integrative Transcriptome and Metabolome Analysis Identifies Potential Pathways Associated with Cadmium Tolerance in Two Maize Inbred Lines
- PMID: 40573841
- PMCID: PMC12196682
- DOI: 10.3390/plants14121853
Integrative Transcriptome and Metabolome Analysis Identifies Potential Pathways Associated with Cadmium Tolerance in Two Maize Inbred Lines
Abstract
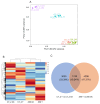
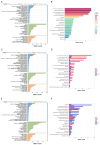
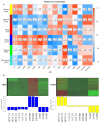
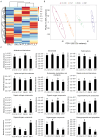
Cadmium (Cd) significantly influences the morphological, physiological traits, and transport capacity of plants, but the underlying mechanism of Cd stress still remains to be further studied. In this study, physiological, transcriptomic, and metabolomic analyses were conducted to examine the morphological and physiological traits of two elite maize inbred lines, Chang7_2 (C7_2, a Cd-resistant line) and Zheng58 (Z58, a Cd-sensitive line) under control and Cd stress conditions. The results of morphological traits indicated that C7_2 reduced by 9.50-29.60% under Cd stress, whereas Z58 displayed more pronounced morphological changes ranging from 10.12 to 41.72% under Cd stress. Physiological assessments revealed that C7_2 maintained relatively stable antioxidant enzyme activity, while Z58 demonstrated more rapid alterations in the antioxidant system under Cd stress. Transcriptomic analysis identified 3030 differentially expressed genes (DEGs) unique to C7_2 and 4298 DEGs unique to Z58, with 1746 common DEGs shared between the two lines. Functional annotation revealed that the unique DEGs in C7_2 were mainly enriched in plant hormone signal transduction, plant-pathogen interactions, and the MAPK signaling pathway, while the unique DEGs in Z58 were mainly enriched in ribosome-related functions, plant hormone signal transduction, and phenylpropanoid biosynthesis. Metabolomic analysis identified 12 superclasses encompassing 896 metabolites in C7_2 and Z58, primarily including lipids and lipid-like molecules, organic acids and derivatives, as well as organoheterocyclic compounds. Analysis of differentially accumulated metabolites (DAMs) revealed fewer DAMs were accumulated in C7_2 under Cd stress. Further analysis identified that the three pathways of GPI anchor biosynthesis, glycerophospholipid metabolism, and purine metabolism were among the top 10 metabolic pathways in C7_2 and Z58. The integrative analysis highlighted the crucial roles of phenylpropanoid biosynthesis and zeatin biosynthesis in C7_2 for resistance to Cd stress. This study provides novel insights into the molecular and metabolic pathways underlying Cd tolerance in maize by integrating transcriptomic and metabolomic analyses of two contrasting inbred lines, providing a theoretical foundation for the future breeding of Cd-tolerant varieties.
Keywords: cadmium stress; maize; metabolome; seedling stage; transcriptome.
Conflict of interest statement
The authors declare no conflicts of interest.
Figures


Similar articles
-
Molecular Mechanisms Underlying Salt Tolerance in Maize: A Combined Transcriptome and Metabolome Analysis.Plants (Basel). 2025 Jul 2;14(13):2031. doi: 10.3390/plants14132031. Plants (Basel). 2025. PMID: 40648040 Free PMC article.
-
Metabolome integrated with transcriptome, and genome analysis revealed higher accumulations of phytoalexins enhance resistance against Magnaporthe oryzae in new Zhefang rice variety diantun 506.BMC Plant Biol. 2025 Jul 2;25(1):836. doi: 10.1186/s12870-025-06856-5. BMC Plant Biol. 2025. PMID: 40604494 Free PMC article.
-
Integrated physiological, transcriptomic and metabolomic analysis revealed heterosis for cadmium tolerance in maize.Plant Physiol Biochem. 2025 Jul 17;228:110265. doi: 10.1016/j.plaphy.2025.110265. Online ahead of print. Plant Physiol Biochem. 2025. PMID: 40695211
-
Intravenous magnesium sulphate and sotalol for prevention of atrial fibrillation after coronary artery bypass surgery: a systematic review and economic evaluation.Health Technol Assess. 2008 Jun;12(28):iii-iv, ix-95. doi: 10.3310/hta12280. Health Technol Assess. 2008. PMID: 18547499
-
A rapid and systematic review of the clinical effectiveness and cost-effectiveness of topotecan for ovarian cancer.Health Technol Assess. 2001;5(28):1-110. doi: 10.3310/hta5280. Health Technol Assess. 2001. PMID: 11701100
References
-
- Khan M.U., Shahbaz N., Waheed S., Mahmood A., Shinwari Z.K., Malik R.N. Comparative health risk surveillance of heavy metals via dietary foodstuff consumption in different land-use types of pakistan. Hum. Ecol. Risk Assess. Int. J. 2016;22:168–186. doi: 10.1080/10807039.2015.1056294. - DOI
Grants and funding
- 32301772/National Natural Science Foundation of China
- 252102110278/Key Scientific and Technological Research Project of Henan Province
- 2022010204/Joint Research on Agricultural Improved Seed of Henan Province
- SN01-2022-02/Shennong Laboratory First-rate Research Subject
- 241111114300/Key Research and Development Project of Henan Province
LinkOut - more resources
Full Text Sources
Miscellaneous

