

Microbial-Mediated Soil Nutrient Enhancement in Moso Bamboo- Liquidambar formosana vs. Phoebe chekiangensis Mixed Plantings
- PMID: 40573861
- PMCID: PMC12196586
- DOI: 10.3390/plants14121868
Microbial-Mediated Soil Nutrient Enhancement in Moso Bamboo- Liquidambar formosana vs. Phoebe chekiangensis Mixed Plantings
Abstract
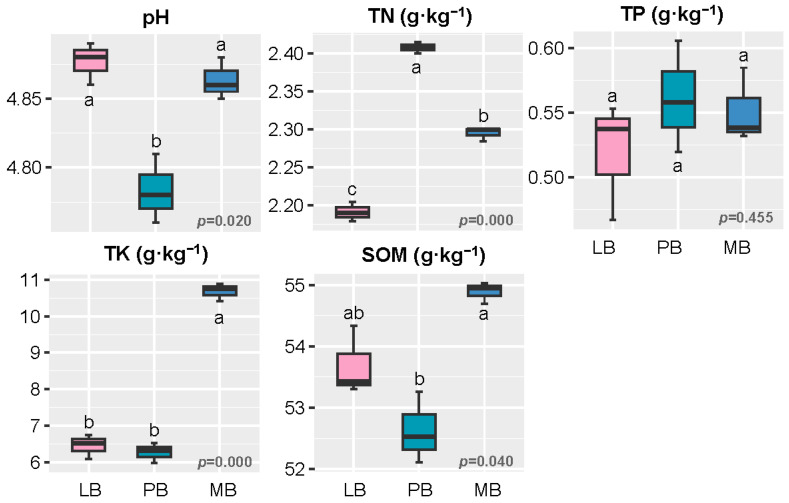
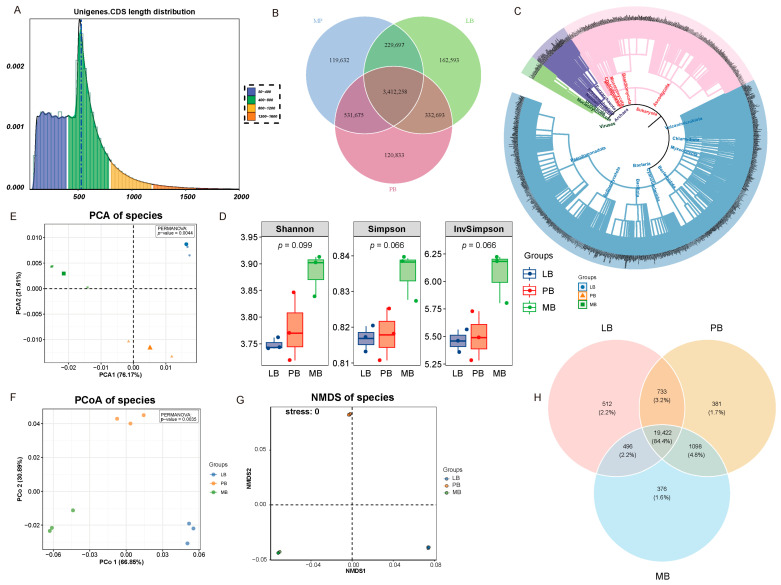
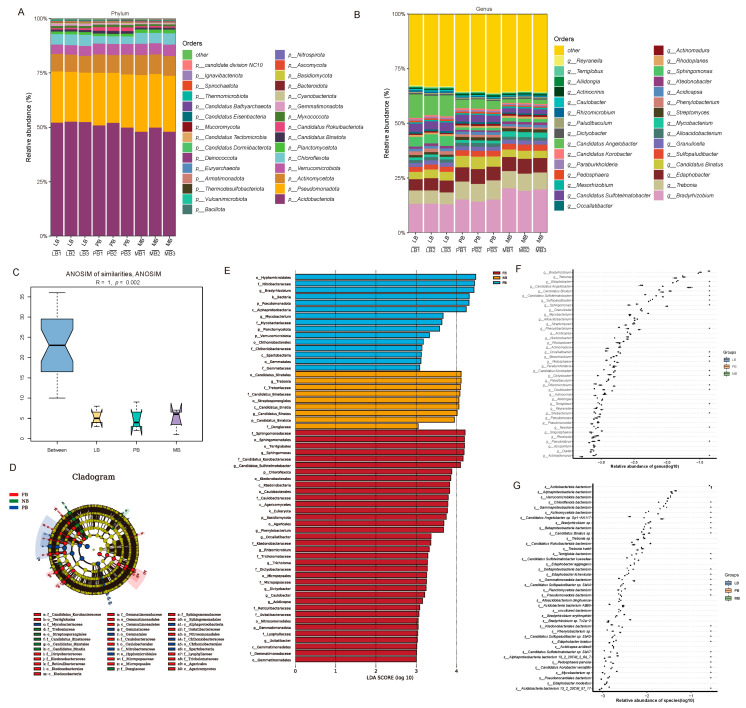
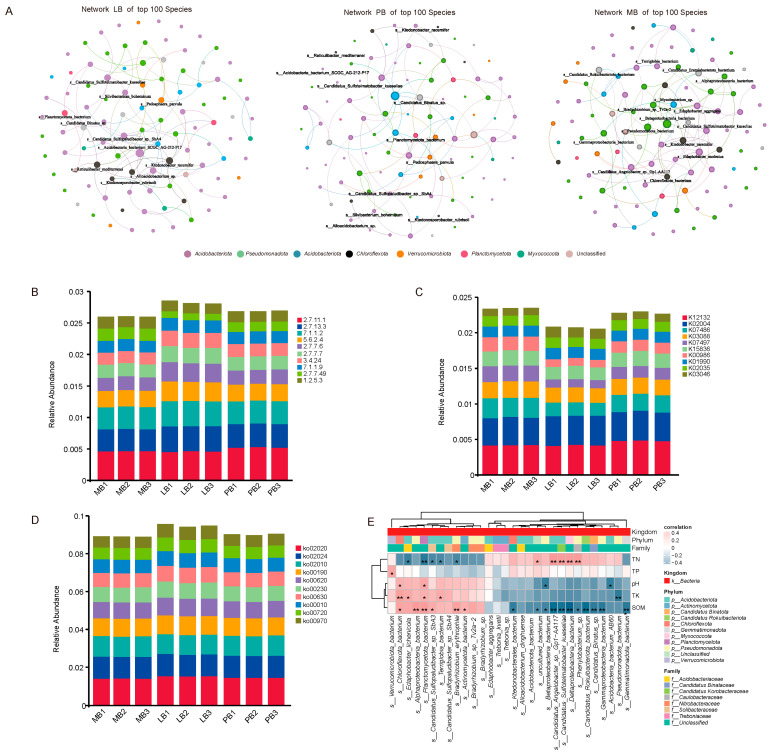
This study investigated how Moso bamboo (Phyllostachys edulis)-broadleaf mixed forests influence soil properties and microbial communities to support ecological function and sustainable bamboo forest management. Three forest types were examined: pure Moso bamboo stands (MB) and mixed stands with Liquidambar formosana (LB) or Phoebe chekiangensis (PB). Soil chemical properties, microbial diversity, and community composition were assessed using high-throughput sequencing, and functional taxa were correlated with soil nutrients. The results showed that mixed forests significantly influenced soil chemical properties. PB showed the lowest pH and highest total nitrogen (TN), while MB exhibited the highest soil organic matter (SOM) and total potassium (TK). LB maintained moderate TN, high SOM and TK, and stable pH, indicating a balanced nutrient profile. Although α-diversity did not differ significantly, β-diversity analysis revealed distinct microbial community structure (p < 0.01). LB was enriched with carbon-decomposing taxa (Terriglobales and Sphingomonas), PB with acid-tolerant, nitrogen-cycling groups (Candidatus Binatus), and MB with nitrogen-fixing taxa (Nitrobacteraceae and Bradyrhizobium). Co-occurrence network and functional pathway analyses indicated group-specific microbial associations and greater metabolic diversity in LB and PB. In conclusion, mixed Moso bamboo with broadleaf species significantly modified soil chemical properties and microbial community structure, with the Moso bamboo-L. formosana combination showing potential for improving soil nutrient status and microbial function.
Keywords: Liquidambar formosana; Moso bamboo; broadleaf transformation; soil microbial structure and function; soil nutrients.
Conflict of interest statement
The authors declare no conflicts of interest.
Figures
Similar articles
-
Microbial mechanisms of carbon sequestration discrepancy between broadleaf and Moso bamboo forests.Front Microbiol. 2025 Jun 3;16:1580720. doi: 10.3389/fmicb.2025.1580720. eCollection 2025. Front Microbiol. 2025. PMID: 40529580 Free PMC article.
-
Moso bamboo (Phyllostachys edulis (Carrière) J. Houzeau) invasion affects soil microbial communities in adjacent planted forests in the Lijiang River basin, China.Front Microbiol. 2023 Feb 21;14:1111498. doi: 10.3389/fmicb.2023.1111498. eCollection 2023. Front Microbiol. 2023. PMID: 36896433 Free PMC article.
-
[Effects of Simulated Acid Rain on Soil Fungi Diversity in the Transition Zone of Moso Bamboo and Broadleaf Forest].Huan Jing Ke Xue. 2020 May 8;41(5):2476-2484. doi: 10.13227/j.hjkx.201910180. Huan Jing Ke Xue. 2020. PMID: 32608867 Chinese.
-
The role of edaphic variables and management practices in regulating soil microbial resilience to drought - A meta-analysis.Sci Total Environ. 2024 Feb 20;912:169544. doi: 10.1016/j.scitotenv.2023.169544. Epub 2023 Dec 21. Sci Total Environ. 2024. PMID: 38141972
-
Systemic pharmacological treatments for chronic plaque psoriasis: a network meta-analysis.Cochrane Database Syst Rev. 2021 Apr 19;4(4):CD011535. doi: 10.1002/14651858.CD011535.pub4. Cochrane Database Syst Rev. 2021. Update in: Cochrane Database Syst Rev. 2022 May 23;5:CD011535. doi: 10.1002/14651858.CD011535.pub5. PMID: 33871055 Free PMC article. Updated.
References
-
- Zhou F.C. Bamboo Cultivation. China Agriculture Press; Beijing, China: 1998.
Grants and funding
- No. 2024131022/the 2024 Forestry and Grassland Soft Science Project, "Pathways and Strategies for Achieving Carbon Neutrality in Protected Areas through Bamboo Utilization"
- No. HDY25N020/the 2025 Science and Technology Research Project of the East China Survey and Planning Institute, National Forestry and Grassland Administration, "Key Technologies for the Preparation of Construction Materials in Protected Areas and Environmental Impact A
- LQ23C030001/the Zhejiang Provincial Natural Science Foundation project
LinkOut - more resources
Full Text Sources
Miscellaneous
