

Comparative Analysis of Long-Term Measles Immune Response After Natural Infection and Routine Vaccination in China
- PMID: 40573886
- PMCID: PMC12197537
- DOI: 10.3390/vaccines13060555
Comparative Analysis of Long-Term Measles Immune Response After Natural Infection and Routine Vaccination in China
Abstract
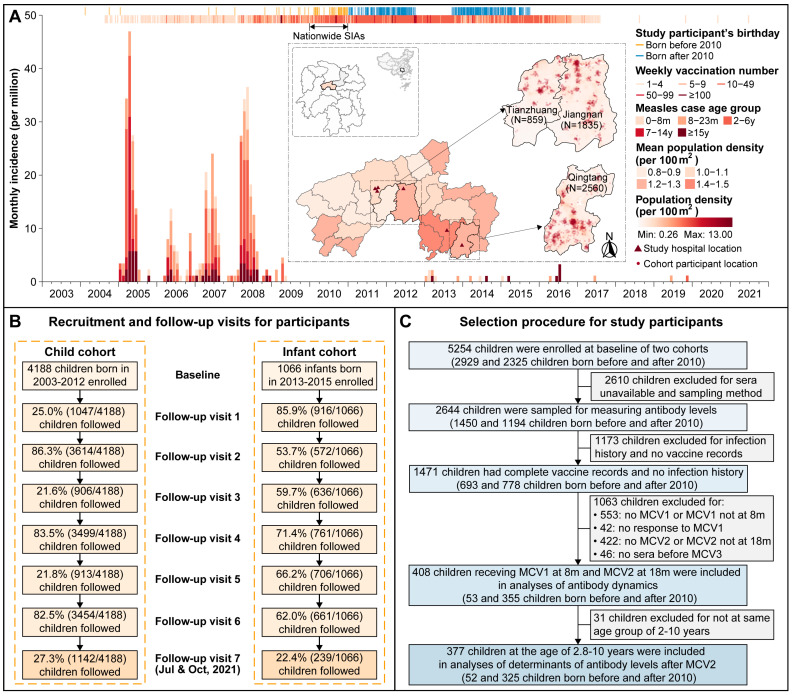
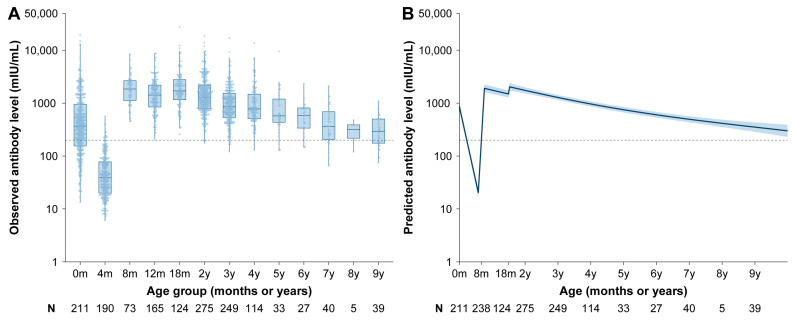
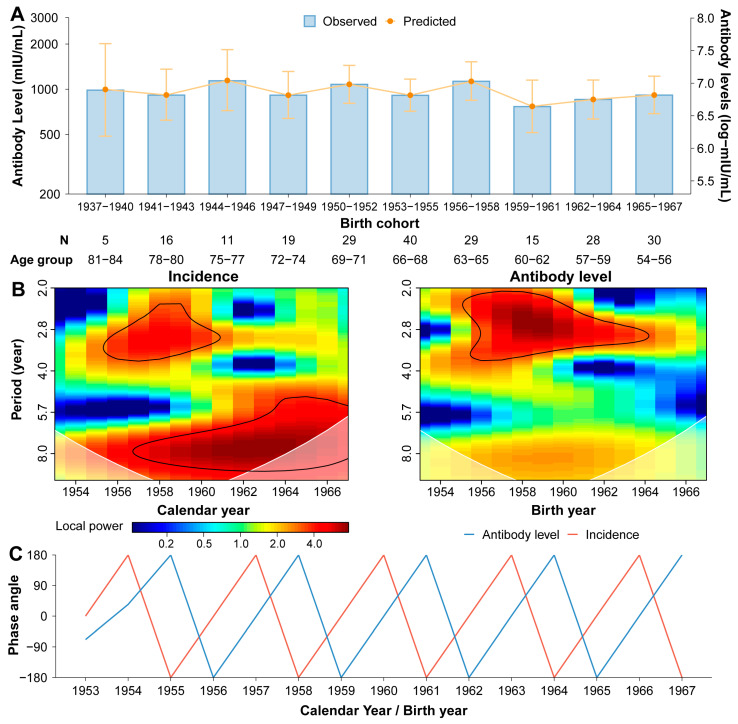
Background: Given the significant impact of population immunity on the measles epidemic, understanding immunity differences among populations with varying immunity backgrounds is necessary for identifying immunity gaps and informing vaccination policies. In this study, we aimed to determine the distinct dynamics of vaccine-induced and naturally acquired antibodies, with specific focus on difference in vaccine-induced antibody responses across different birth cohorts. Methods: Based on two cohorts and one cross-sectional study conducted in Anhua County, Hunan Province, China, serum samples from children who followed China's routine measles vaccination schedule (i.e., two-dose schedule at 8/18 months) and adults who acquired immunity through natural infection were tested for measles IgG antibodies using an enzyme-linked immunosorbent assay. The generalized additive mixed model and a mechanistic model were employed to describe antibody dynamics following vaccination and infections. Wavelet analysis was used to investigate the temporal relationship between the measles epidemic and long-term antibody levels after natural infection. Results: A total of 408 children (0-12 years) and 222 adults (54-84 years) were included in the present study. Vaccine-induced antibody levels following 8 m/18 m vaccination were estimated to fall below the protective threshold of 200 mIU/mL by age of 15.8, whereas antibody levels following infections remained high. The decay rate of vaccine-induced antibodies was estimated at 3.0 × 10⁻³ log-log mIU/mL per year, whereas naturally acquired measles antibodies persisted lifelong with a significantly lower decay rate of 2.30 × 10⁻⁵ log-log mIU/mL per year. Moreover, vaccine-induced antibody levels in children born after 2010-a period of low measles incidence-declined more rapidly (duration of protective immunity: 12.5 years), compared to those born before 2010. Discussion: Our findings revealed immunity heterogeneity among individuals with difference measles immunity backgrounds. In particular, the birth-cohort specific differences in vaccine-induced immunity highlighted the key role of young generations born in settings with low measles incidence in contributing to population immunity gaps. This underlines that greater attention should be given to this group in future catch-up vaccination efforts.
Keywords: antibody dynamics; measles; natural infection; vaccination.
Conflict of interest statement
H.Y. has received research funding from Sanofi Pasteur, Shenzhen Sanofi Pasteur Biological Products Co., Ltd., Shanghai Roche Pharmaceutical Company, and SINOVAC Biotech Ltd. None of the research funding is related to this work. The other authors declare no known competing financial interests or personal relationships that could have influenced the work reported in this paper.
Figures

Similar articles
-
Vaccines for measles, mumps, rubella, and varicella in children.Cochrane Database Syst Rev. 2021 Nov 22;11(11):CD004407. doi: 10.1002/14651858.CD004407.pub5. Cochrane Database Syst Rev. 2021. PMID: 34806766 Free PMC article.
-
Immunogenicity and seroefficacy of pneumococcal conjugate vaccines: a systematic review and network meta-analysis.Health Technol Assess. 2024 Jul;28(34):1-109. doi: 10.3310/YWHA3079. Health Technol Assess. 2024. PMID: 39046101 Free PMC article.
-
Herd Immunity to the Measles, Mumps and Rubella Viruses Among the Belgradian Population in May, 2024.Vaccines (Basel). 2025 Jun 18;13(6):652. doi: 10.3390/vaccines13060652. Vaccines (Basel). 2025. PMID: 40573983 Free PMC article.
-
Antibody tests for identification of current and past infection with SARS-CoV-2.Cochrane Database Syst Rev. 2022 Nov 17;11(11):CD013652. doi: 10.1002/14651858.CD013652.pub2. Cochrane Database Syst Rev. 2022. PMID: 36394900 Free PMC article.
-
Adefovir dipivoxil and pegylated interferon alfa-2a for the treatment of chronic hepatitis B: a systematic review and economic evaluation.Health Technol Assess. 2006 Aug;10(28):iii-iv, xi-xiv, 1-183. doi: 10.3310/hta10280. Health Technol Assess. 2006. PMID: 16904047
References
-
- Wang H., An Z., Yin Z. Achievements in prevention and control of seven infectious diseases targeted by the National Immunization Program in China across 70 years. Chin. J. Vaccines Immun. 2019;25:359–367.
-
- Leung J., Munir N.A., Mathis A.D., Filardo T.D., Rota P.A., Sugerman D.E., Sowers S.B., Mercader S., Crooke S.N., Gastañaduy P.A. The Effects of Vaccination Status and Age on Clinical Characteristics and Severity of Measles Cases in the United States in the Post-Elimination Era, 2001–2022. Clin. Infect. Dis. 2024;80:663–672. doi: 10.1093/cid/ciae470. - DOI - PMC - PubMed
Grants and funding
LinkOut - more resources
Full Text Sources
