. 2025 May 28;13(6):577.
doi: 10.3390/vaccines13060577.

Synergistic Antitumor Effects of Caerin Peptides and Dendritic Cell Vaccines in a 4T-1 Murine Breast Cancer Model

Affiliations

Synergistic Antitumor Effects of Caerin Peptides and Dendritic Cell Vaccines in a 4T-1 Murine Breast Cancer Model

Rongmi Mo et al. Vaccines (Basel). .

Abstract

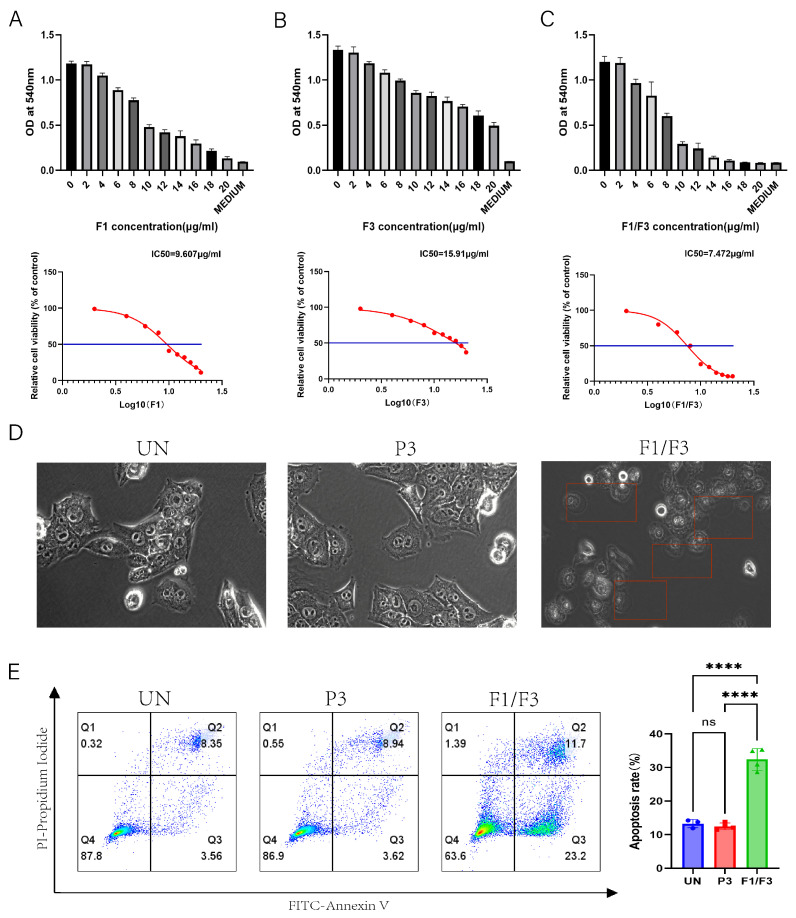
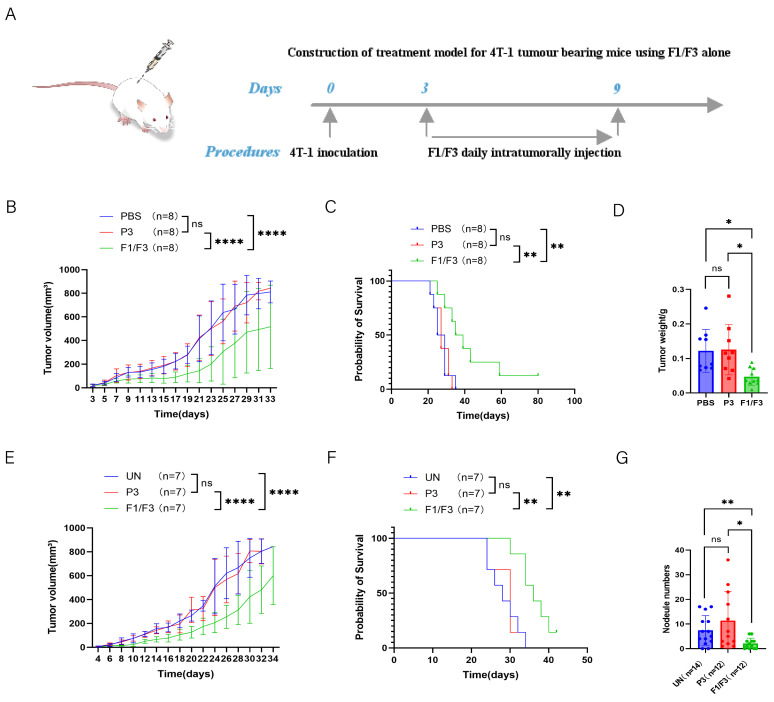
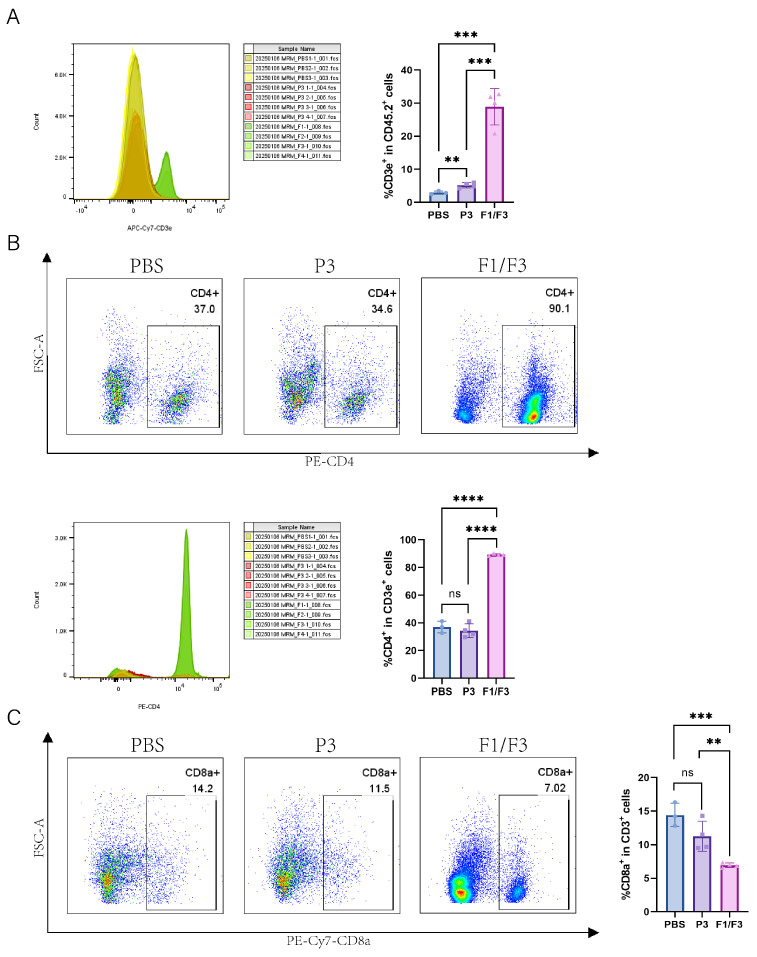
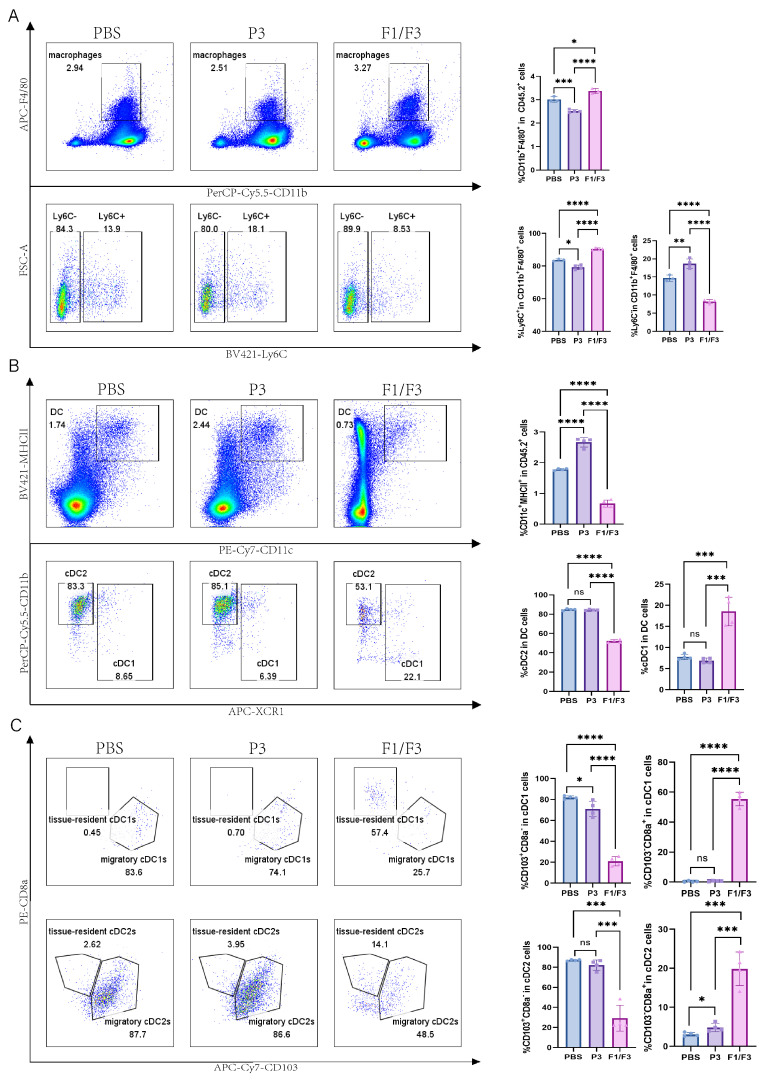
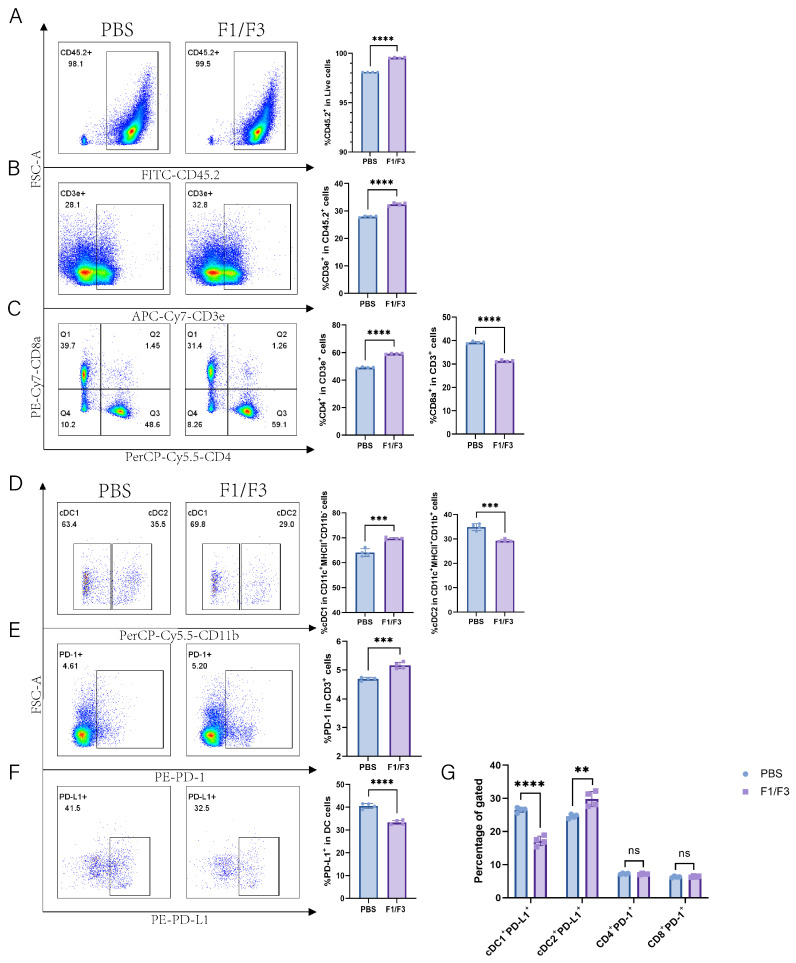
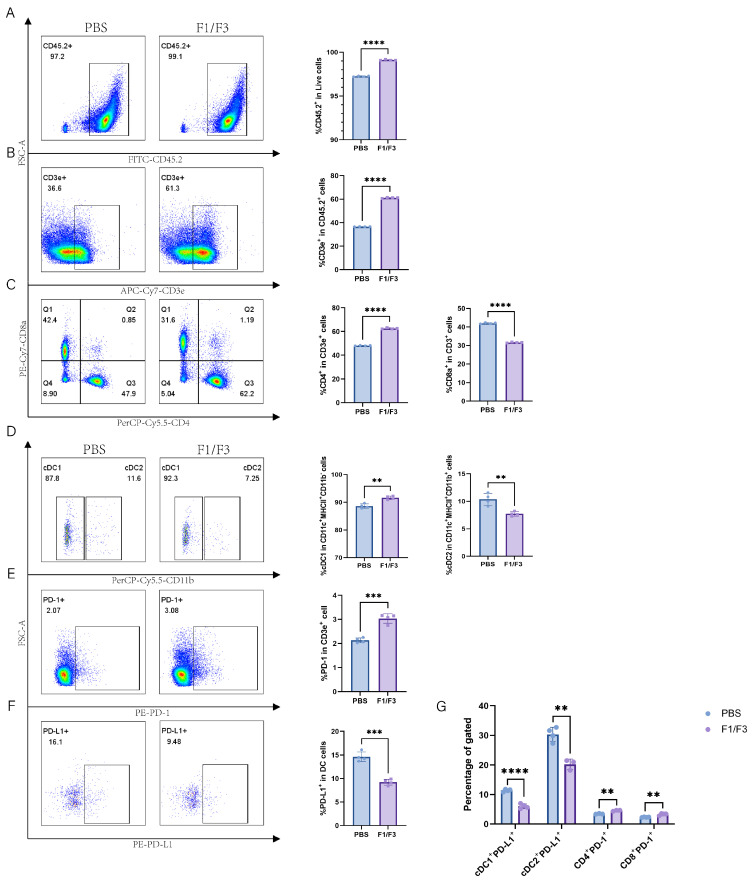
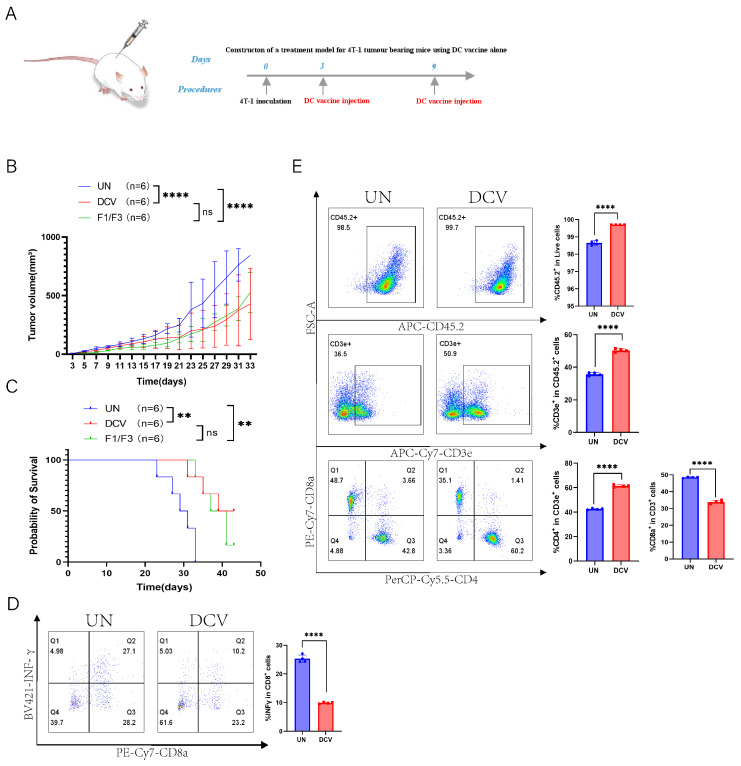
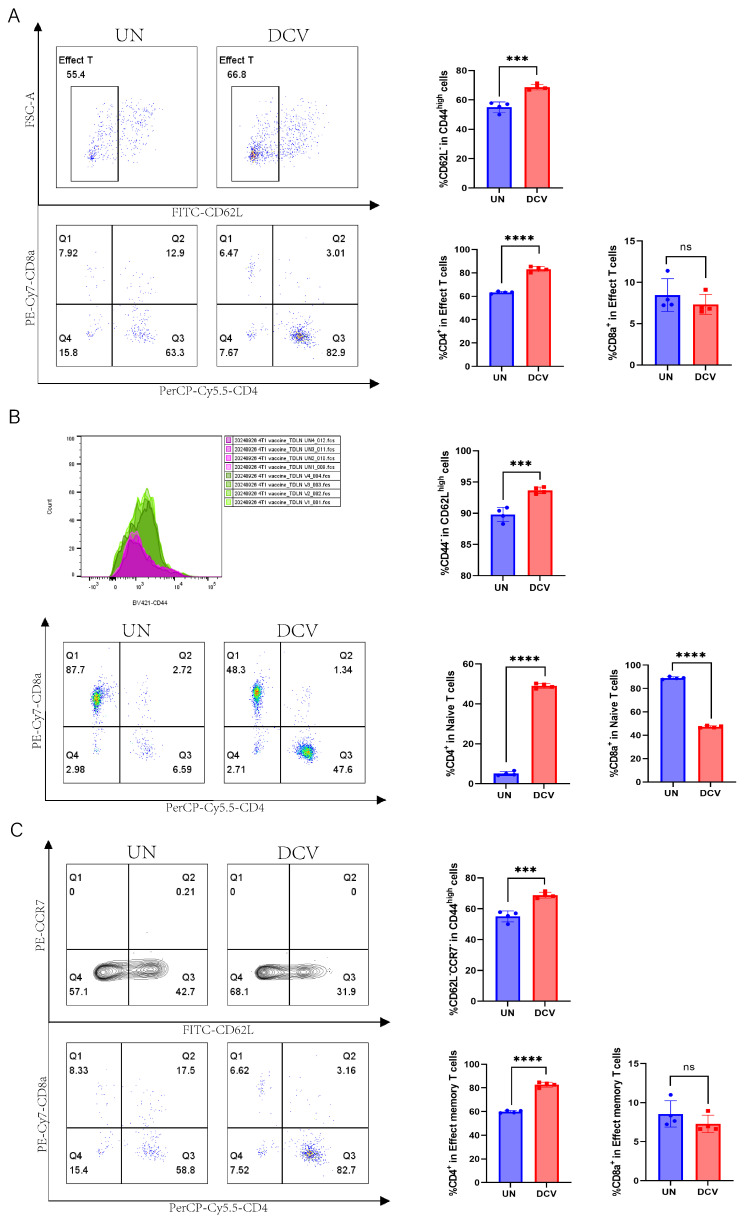
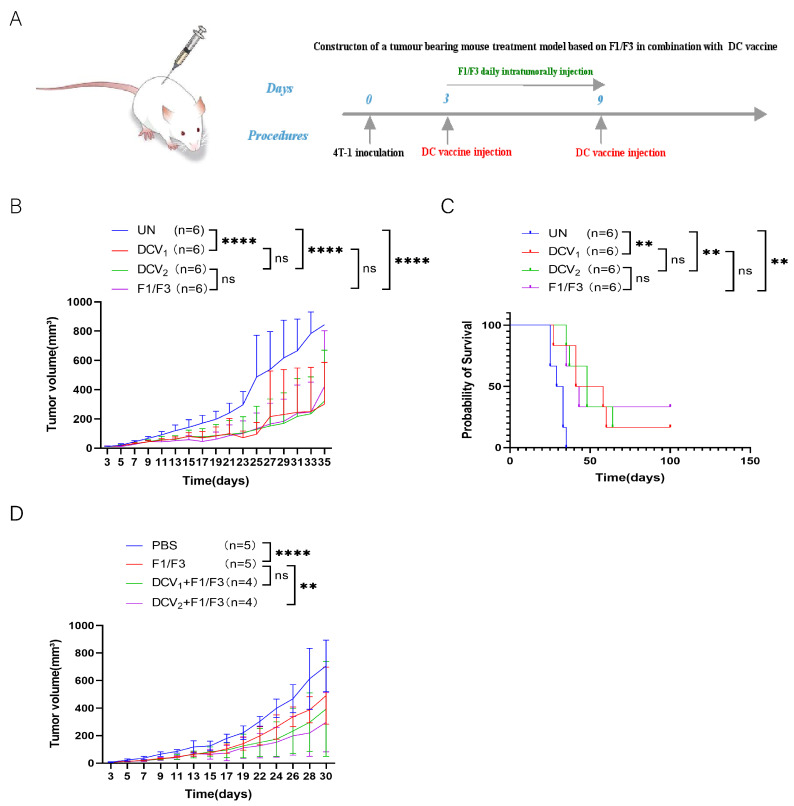
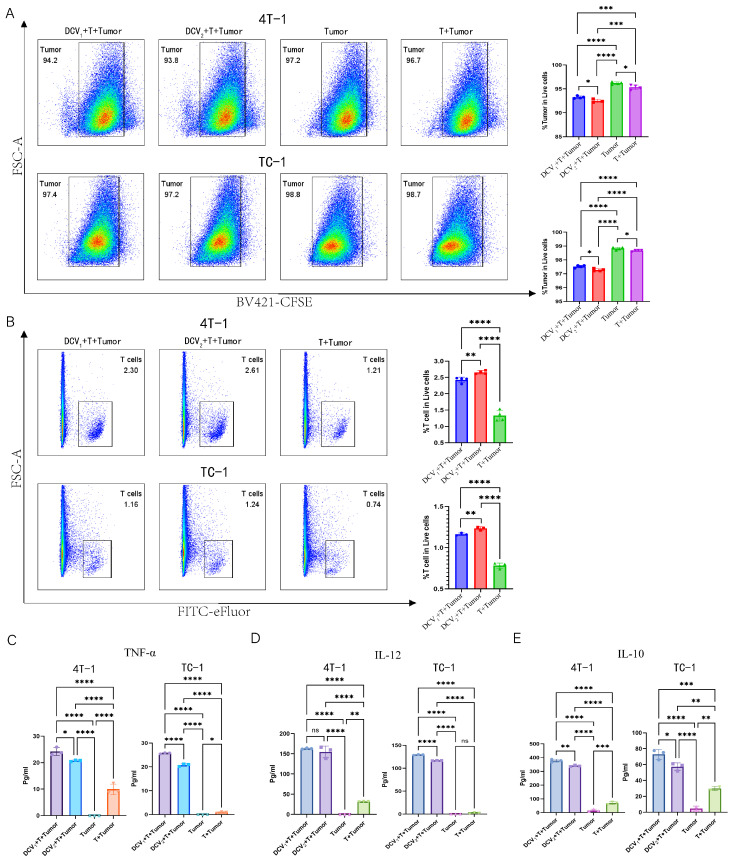
Background/Objectives: Breast cancer remains a leading cause of cancer-related mortality among women worldwide, necessitating novel therapeutic strategies. This study aimed to investigate the synergistic antitumor effects of caerin peptides (F1/F3) combined with dendritic cell (DC) vaccines in a 4T-1 murine breast cancer model, providing new insights for breast cancer immunotherapy. Methods: In vitro experiments evaluated the effects of F1/F3 on 4T-1 cell proliferation and apoptosis. A 4T-1 breast cancer mouse model was established, and treatments included F1/F3 alone, DC vaccines (DCV1: loaded with whole tumor antigens; DCV2: loaded with F1/F3-induced apoptotic antigens), or combination therapy. Flow cytometry analyzed immune cell subsets in the tumor microenvironment and lymph nodes, while ELISA measured cytokine levels. Results: F1/F3 significantly inhibited 4T-1 cell proliferation and induced apoptosis while suppressing tumor growth and lung metastasis in vivo. Flow cytometry revealed increased infiltration of CD4+ T cells and cDC1 in tumors, along with reduced PD-L1 expression. DCV2 exhibited stronger T-cell proliferation induction and lower IL-10 secretion in vitro. Combination therapy with DCV2 and F1/F3 demonstrated superior tumor suppression compared to monotherapy. Conclusions: F1/F3 enhances antitumor immunity by modulating the tumor microenvironment, and its combination with DCV2 yields synergistic effects. This study provides experimental evidence for combination immunotherapy in breast cancer, with potential for further optimization of DC vaccine design to improve efficacy.

Keywords: 4T-1; DC vaccine; DLNs; TME; caerin 1.1/1.9.


Conflict of interest statement

The authors J.L., Y.L. (Yuandong Luo) and Q.F. were employed by the Zhongao Biomedical Technology (Guangdong) Co., Ltd. The remaining authors declare that this research was conducted in the absence of any commercial or financial relationships that could be construed as potential conflicts of interest. The authors declare no conflict of interest.

Figures

Figure 1
Figure 1
F1, F3, and F1/F3 inhibit 4T-1 cell proliferation. F1, F3, and F1/F3 inhibit the proliferation of 4T-1 cells, as assessed by the MTT assay. (A) The half-maximal inhibitory concentration (IC50) of F1 alone was 9.607 μg/mL; (B) F3 alone showed an IC50 of 15.91 μg/mL; (C) the combination of F1 and F3 (F1/F3) yielded an IC50 of 7.472 μg/mL; (D) representative microscopy images of 4T-1 cells under: no treatment (UN), P3, and F1/F3 at 10 μg/mL revealing morphological changes; Red boxes: cells with changed morphology; Microscope at 20× magnification; (E) flow cytometry results comparing apoptosis in 4T-1 cells among the UN, P3, and F1/F3 groups. Left: streaming scatter plot of different groups; Right: bar chart, UN group (blue), P3 group (red), F1/F3 group (green). Data in (AE) represent an independent experiment repeated twice. The results are expressed as mean ± SD. ns, not significant; **** p < 0.0001. Statistical analyses were performed using one-way ANOVA for (AC) and Student’s t-test for (E).
Figure 2
Figure 2
F1/F3 inhibits 4T-1 tumor growth in vivo. (A) 4T-1 cells (5 × 10⁵/200 μL) were injected subcutaneously into the lateral flanks of BALB/c mice, followed by local administration of PBS, P3, or F1/F3; (B) tumor volume and (C) survival curves; (D) tumor weights were measured on Day 18. 4T-1 cells (5 × 10⁵/200 μL) were injected into the fourth mammary fat pad of BALB/c mice, PBS, P3, or F1/F3 was administered intratumorally; (E) tumor growth and (F) survival rates in this model; (G) on day 30, lungs were isolated and stained with 15% India ink, and pulmonary nodules were counted (n: number of experimental mice). Each group has 3–8 mice. Data in (AF) represent a single independent experiment, whereas (G) pools data from two independent experiments. The results are shown as mean ± SD. ns, not significant; * p < 0.05; ** p < 0.01; **** p < 0.0001. Statistical analyses were carried out using two-way ANOVA for (B,E), Kaplan–Meier survival analysis for (C,F), one-way ANOVA for (D), and Student’s t-test for (G).
Figure 3
Figure 3
F1/F3 regulating intratumoral T cell responses in 4T-1 tumor-bearing mice. Flow cytometric analysis of T cells in the tumor microenvironment (TME) of PBS-, P3-, and F1/F3-treated 4T-1 tumor-bearing mice, including (A) T cells (CD45.2+CD3e+); (B) CD4+ T cells (CD45+CD3e+CD4+); (C) CD8+ T cells (CD45+CD3e+CD8+). PBS group (blue), P3 group (purple), F1/F3 group (pink). Each experiment used 3–6 mice per group. (AC) represent single independent experiments, each repeated once. Data are expressed as mean ± SD. ns, not significant; ** p < 0.01; *** p < 0.001; **** p < 0.0001. Statistical analysis was carried out by Student’s t-test.
Figure 4
Figure 4
Modulation of intratumoral macrophages and DC subsets in 4T-1 tumor-bearing mice. Flow cytometric analysis of macrophages and DC subsets in the tumor microenvironment (TME) of PBS-, P3-, and F1/F3-treated 4T-1 tumor-bearing mice, including (A) macrophages (CD45+CD11b+F4/80+), M1 (CD45+CD11b+F4/80+Ly6C+) vs. M2 (CD45+CD11b+F4/80+Ly6C); (B) DCs (CD45.2+CD11c+MHCII+), cDC1 (CD45.2+CD11c+MHCII+XCR1+), cDC2 (CD45.2+CD11c+MHCII+XCR1CD11b+); (C) migratory cDC1 (CD45.2+CD11c+MHCII+XCR1+CD103+CD8a), resident cDC1 (CD45.2+CD11c+MHCII+XCR1+CD103CD8a+), migratory cDC2 (CD45.2+CD11c+MHCII+XCR1CD11b+CD103+CD8a), resident cDC2 (CD45.2+CD11c+MHCII+XCR1CD11b+CD103CD8a+). PBS group (blue), P3 group (purple), F1/F3 group (pink). Each experiment used 3–6 mice per group. (AC) represent single independent experiments, each repeated once. Data are expressed as mean ± SD. ns, not significant; * p < 0.05; ** p < 0.01; *** p < 0.001; **** p < 0.0001. Statistical analysis was carried out by Student’s t-test.
Figure 5
Figure 5
F1/F3 modulates T Cells, DC subsets, and PD-1/PD-L1 expression in the lymph nodes of 4T1 tumor-bearing mice. Flow cytometry was performed on draining lymph nodes from PBS- or F1/F3-treated mice to evaluate immune cells, DC subsets, and related factors: (A) CD45.2+ cells; (B) T cells (CD45.2+CD3e+); (C) CD4+ T cells (CD45+CD3e+CD4+), CD8+ T cells (CD45+CD3e+CD8+); (D) cDC1 (CD45.2+LineageCD11c+MHCII+CD11b) vs. cDC2 (CD45.2+LineageCD11c+MHCII+CD11b+); (E) PD-1 (CD45.2+CD3e+PD-1+); (F) PD-L1 (CD45.2+LineageCD11c+MHCII+PD-L1+); (G) PD-L1 expression in cDC1 (CD45.2+LineageCD11c+MHCII+CD11bPD-L1+) and cDC2 (CD45.2+LineageCD11c+MHCII+CD11b+PD-L1+), as well as PD-1 on CD4+ T cells (CD45+CD3e+CD4+PD-1+) and CD8+ T cells (CD45+CD3e+CD8+PD-1+). PBS group (blue), P3 group (purple). Each experiment used 3–6 mice per group. Data in (AG) represent single independent experiments, repeated once, shown as mean ± SD or mean ± SEM. ns, not significant; ** p < 0.01; *** p < 0.001; **** p < 0.0001. Statistical analysis was conducted by Student’s t-test.
Figure 6
Figure 6
F1/F3 improves the immune profile in non-draining lymph nodes of 4T-1 tumor-bearing Mice. Flow cytometric analysis was performed on non-draining lymph nodes from PBS- or F1/F3-treated mice to examine immune cells, DC subsets, and related markers, including (A) CD45.2+ cells; (B) T cells (CD45.2+CD3e+); (C) CD4+ T cells (CD45+CD3e+CD4+), CD8+ T cells (CD45+CD3e+CD8+); (D) cDC1 (CD45.2+LineageCD11c+MHCII+CD11b) vs. cDC2 (CD45.2+LineageCD11c+MHCII+CD11b+); (E) PD-1 (CD45.2+CD3e+PD-1+); (F) PD-L1 (CD45.2+LineageCD11c+MHCII+PD-L1+), and (G) PD-L1 expression on cDC1 (CD45.2+LineageCD11c+MHCII+CD11bPD-L1+), cDC2 (CD45.2+LineageCD11c+MHCII+CD11b+PD-L1+), as well as PD-1 on CD4+ T cells (CD45+CD3e+CD4+PD-1+) and CD8+ T cells (CD45+CD3e+CD8+PD-1+). PBS group (blue), P3 group (purple). Each experiment included 3–6 mice per group. Data in (AG) represent a single independent experiment, repeated once. The results are shown as mean ± SD. ns: not significant; ** p < 0.01; *** p < 0.001; **** p < 0.0001. Student’s t-test was performed (AG).
Figure 7
Figure 7
DC vaccine inhibits 4T-1 tumor growth in vivo. (A) A 4T-1 tumor-bearing mouse model was established in the lateral flank. Tumor growth (B) and survival rates (C) were compared among the untreated (UN) group, DC vaccine group (DCV), and F1/F3 group; flow cytometric analysis of draining lymph nodes measured; (D) IFN-γ secretion (CD45+CD3e+CD8+IFN-γ+) and T-cell subsets, including (E) CD45.2+ cells, T cells (CD45.2+CD3e+), CD4+ T cells (CD45+CD3e+CD4+), and CD8+ T cells (CD45+CD3e+CD8+); UN group (blue), DCV group (red). each group contained 3–6 mice. Data in (AE) represent a single independent experiment repeated once, shown as mean ± SD. Two-way ANOVA was used for (B), Kaplan–Meier analysis for (C), and Student’s t-test for (D,E). ns, not significant; ** p < 0.01; **** p < 0.0001.
Figure 8
Figure 8
Immunomodulatory effects of DC vaccine on intratumoral T cells in 4T-1 tumor-bearing mice. Flow cytometric analysis of T cell subsets in the draining lymph nodes of the untreated (UN) group and DC vaccine group (DCV), including (A) effector T cells (CD45.2+CD3e+CD44highCD62L), effector CD4+ T cells (CD45.2+CD3e+CD44highCD62LCD4+), effector CD8+ T cells (CD45.2+CD3e+CD44highCD62LCD8+); (B) naïve T cells (CD45.2+CD3e+CD62LhighCD44), naïve CD4+ T cells (CD45.2+CD3e+CD62LhighCD44CD4+), and naïve CD8+ T cells (CD45.2+CD3e+CD62LhighCD44CD8+); (C) effector memory T cells (CD45.2+CD3e+CD44highCD62LCCR7), effector memory CD4+ T cells (CD45.2+CD3e+CD44highCD62LCCR7CD4+), and effector memory CD8+ T cells (CD45.2+CD3e+CD44highCD62LCCR7CD8+). UN group (blue), DCV group (red). Each group contained 3–6 mice. Data in (AC) represent a single independent experiment repeated once, shown as mean ± SD. ns, not significant; *** p < 0.001; **** p < 0.0001. Statistical analysis was conducted by Student’s t-test.
Figure 9
Figure 9
DCV2 exhibits superior antitumor activity compared to dCv1. (A) The 4T-1 tumor-bearing mouse model was established in the lateral flank. Mice received either DCV1, DCV2, or F1/F3 alone, and (B) tumor growth and (C) survival rates were recorded. Next, to determine whether DC vaccines could enhance the efficacy of F1/F3, the mice were treated with DCV1 + F1/F3 or DCV2 + F1/F3 (As shown in (A)), and (D) tumor growth was measured. Each group contained 3–6 mice. Data in (AD) represent single independent experiments, each repeated once. The results are shown as mean ± SD. ns, not significant; ** p < 0.01, **** p < 0.0001. Statistical significance was evaluated by two-way ANOVA for (B,D) and Kaplan–Meier survival analysis for (C).
Figure 10
Figure 10
In vitro co-culture of DCV1 or DCV2 with T Cells and tumor cells. Flow cytometric analysis shows (A) that both DCV1 and DCV2 enhance T cell-mediated cytotoxicity against tumor cells (4T-1/TC-1) (DCV1 + T + Tumor (blue), DCV2 + T + Tumor (red), Tumor (green), T + Tumor (purple)) and (B) promote T-cell proliferation(DCV1 + T+Tumor (blue), DCV2 + T + Tumor (red), T + Tumor (green)). Using ELISA kits, we quantified immune-related cytokines in the co-culture supernatants, including (C) TNF-α, (DCV1 + T + Tumor (purple), DCV2 + T + Tumor (blue), Tumor (green), T + Tumor (Orange)) (D) IL-12, and (E) IL-10 (DCV1 + T + Tumor (blue), DCV2 + T + Tumor (purple), Tumor (pink), T + Tumor (green)). Data in (AE) represent a single independent experiment repeated once, shown as mean ± SD. ns, not significant; * p < 0.05; ** p < 0.01; *** p < 0.001; **** p < 0.0001. Statistical analysis was conducted by Student’s t-test for (A,B) or one-way ANOVA for (CE).

References

    1. Ye F., Dewanjee S., Li Y., Jha N.K., Chen Z.S., Kumar A., Vishakha, Behl T., Jha S.K., Tang H. Advancements in clinical aspects of targeted therapy and immunotherapy in breast cancer. Mol. Cancer. 2023;22:105. doi: 10.1186/s12943-023-01805-y. - DOI - PMC - PubMed
    1. Onkar S.S., Carleton N.M., Lucas P.C., Bruno T.C., Lee A.V., Vignali D.A.A., Oesterreich S. The Great Immune Escape: Understanding the Divergent Immune Response in Breast Cancer Subtypes. Cancer Discov. 2023;13:23–40. doi: 10.1158/2159-8290.CD-22-0475. - DOI - PMC - PubMed
    1. Yang L., Hu Q., Huang T. Breast Cancer Treatment Strategies Targeting the Tumor Microenvironment: How to Convert “Cold” Tumors to “Hot” Tumors. Int. J. Mol. Sci. 2024;25:7208. doi: 10.3390/ijms25137208. - DOI - PMC - PubMed
    1. Gadaleta E., Thorn G.J., Ross-Adams H., Jones L.J., Chelala C. Field cancerization in breast cancer. J. Pathol. 2022;257:561–574. doi: 10.1002/path.5902. - DOI - PMC - PubMed
    1. Jacobs A., Lemoine A., Joshi G.P., Van de Velde M., Bonnet F., PROSPECT Working Group Collaborators PROSPECT guideline for oncological breast surgery: A systematic review and procedure-specific postoperative pain management recommendations. Anaesthesia. 2020;75:664–673. doi: 10.1111/anae.14964. - DOI - PMC - PubMed

LinkOut - more resources