. 2025 May 31;17(6):728.
doi: 10.3390/pharmaceutics17060728.

Harnessing Real-Time UV Imaging and Convolutional Neural Networks (CNNs): Unlocking New Opportunities for Empirical In Vitro-In Vivo Relationship Modelling

Affiliations

Harnessing Real-Time UV Imaging and Convolutional Neural Networks (CNNs): Unlocking New Opportunities for Empirical In Vitro-In Vivo Relationship Modelling

Maciej Stróżyk et al. Pharmaceutics. .

Abstract

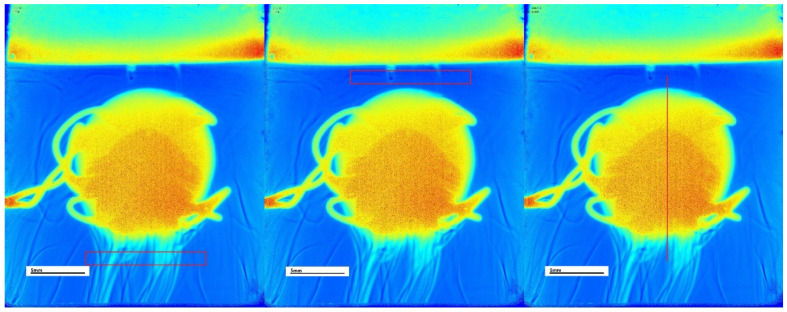
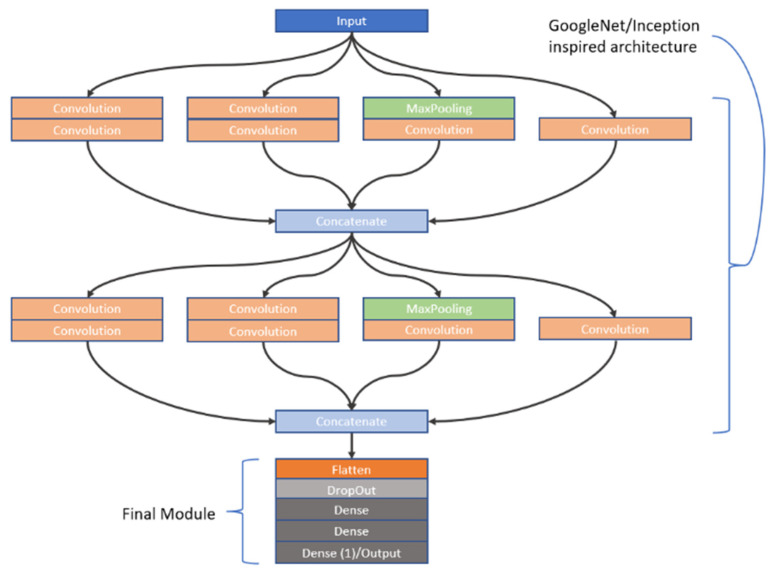
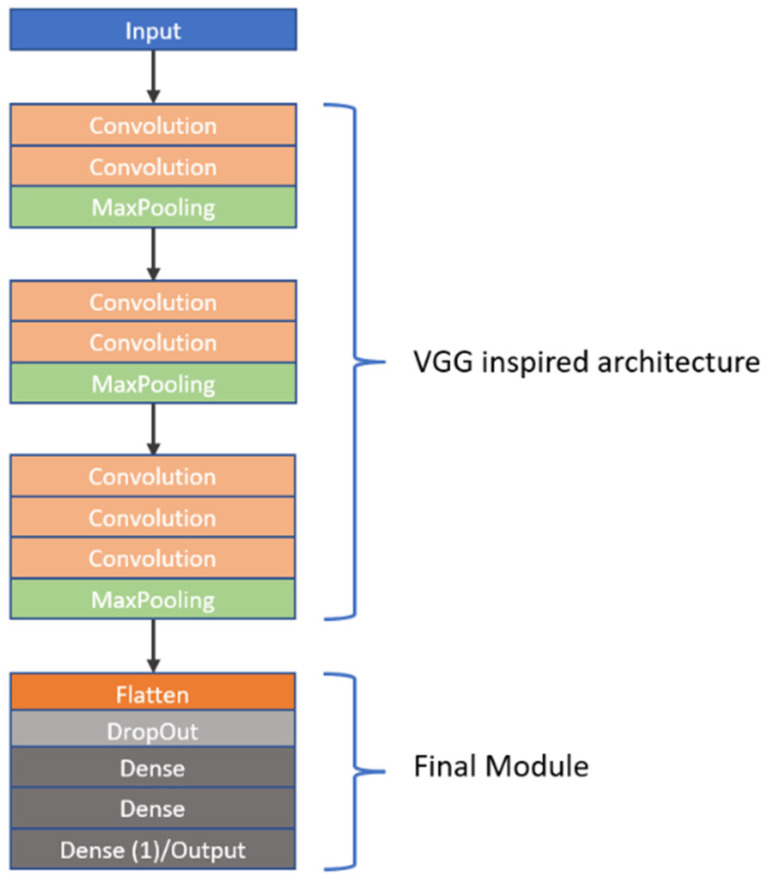
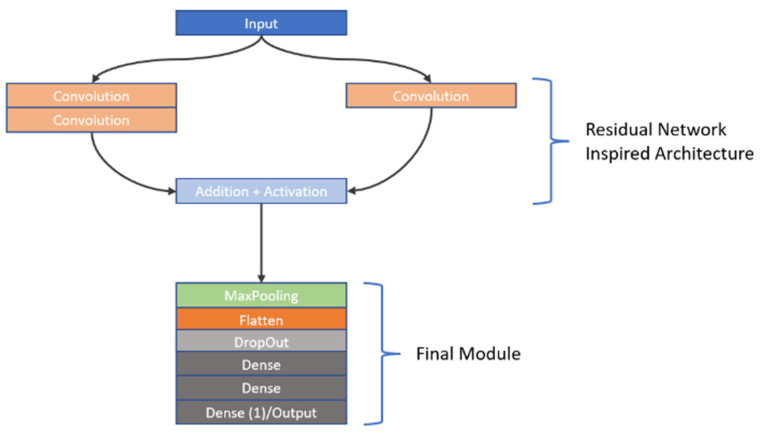
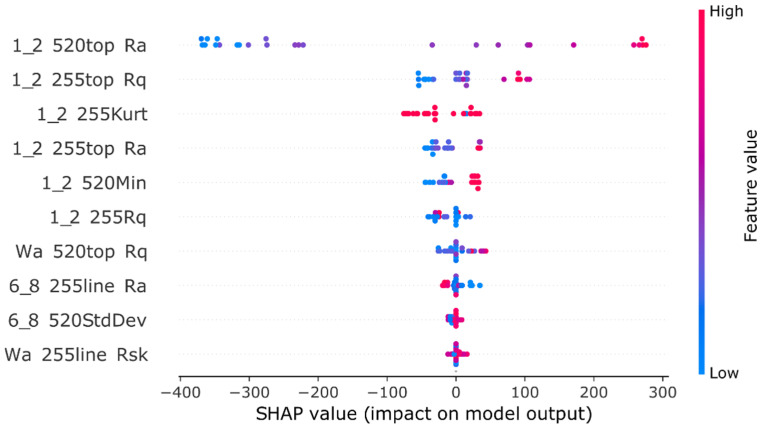
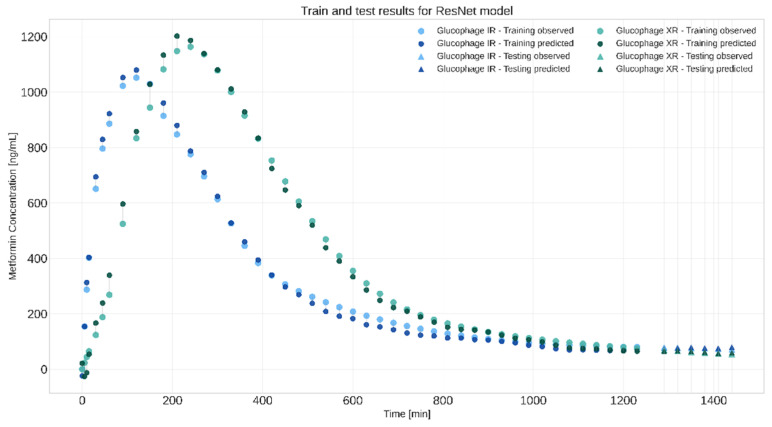
Background: This study delves into the potential use of real-time UV imaging of the dissolution process combined with convolutional neural networks (CNNs) to develop multidimensional models representing the relation between in vitro and in vivo performance of drugs. Method: We utilised the capabilities of the SDi2 apparatus (Pion) to capture multidimensional dissolution data for two distinct Glucophage tablets: immediate-release 500 mg tablets and extended-release 750 mg tablets. The dissolution process was studied in various media, including a compendial pH 1.2 HCl solution, reverse osmosis water, and pH 6.8 phosphate buffer. Result: Moreover, results were captured at different wavelengths (255 nm and 520 nm) to provide a comprehensive view of the process. Our investigation focuses on two primary approaches: (1) analysing numerical data extracted from SDi2 images via a surface characterisation tool, using traditional machine learning techniques, including Scikit-learn, Tensorflow, and AutoML, and (2) utilising raw SDi2 images to train CNNs for direct prediction of in vivo metformin plasma concentrations. Conclusions: This dual approach allows us to assess the impact of data extraction on model performance and explore the potential of CNNs to capture complex dissolution patterns directly from images, potentially revealing hidden information not captured by traditional numerical data extraction methods.

Keywords: SDi2; artificial intelligence (AI); convolutional neural networks (CNN); in vitro in vivo relationship; surface dissolution UV imaging.


Conflict of interest statement

The authors declare no conflicts of interest.

Figures

Figure 1
Figure 1
An example of the ROI selections (in red) on a single frame of the IR 500 mg tablet in pH 1.2 HCl measured at 255 nm. The first image shows the bottom rectangle ROI, followed by an image showing the top rectangle ROI, followed by the final image showing third ROI, which is the line down the height of the tablet. ROI—regions of interest. The scale is visible in the white rectangle, the black line representing 5 mm. The images utilize a jet colour scale where blue indicates the lowest absorption and red indicates the highest absorption at 255 nm. The SurfCharJ plugin version 1q [18] for ImageJ was applied to characterise ROIs by calculating local roughness, gradient analysis as well as the Kurtosis of the assessed profile, amongst other surface parameters. The final image processing procedure consisted of the manual selection and measurement of the tablet area in each frame. This involved the selection of the tablet area in all frames and the use of the built-in ImageJ measurement/analysis tool. This had to be conducted manually, as a separate tablet tracking tool/model would have to be developed to correctly select the tablet area in each frame.
Figure 2
Figure 2
A graphical representation of the GoogleNet-inspired network. Two inception v1 modules are highlighted, which are then followed by the final module.
Figure 3
Figure 3
A graphical representation of the VGG-inspired network. The linear structure composed of convolutional and max-pooling layers is taken from the VGG network, followed by the final module.
Figure 4
Figure 4
A graphical representation of the ResNet-inspired network. It consists of just 1 residual learning building block, followed by the final module.
Figure 5
Figure 5
SHAP analysis of the H2O AutoML generated model, displaying the SHAP value or impact on model output of the 10 most impactful features/parameters. The first part of the feature name represents the media in which the dissolution process took place (1_2 meaning pH 1.2 buffer, Wa meaning Water and 6_8 meaning pH 6.8 buffer), the second part of the name represents the wavelength from which that particular frame was retrieved (255 and 520), the last parts of the feature name, are either the ROI (top rectangle/line or blank being the bottom rectangle) or the parameter which was calculated, as described in the methodology Section 2.4. In this case, the feature values are represented by colour, high feature value being a shade of red, and a low feature value being a shade of blue. Ra: Arithmetic mean deviation; Rq: Root mean square deviation; Kurt: Kurtosis; Rsk: Skewness; Min: Minimum values in the assessment; StdDev: Standard deviation measurements.
Figure 6
Figure 6
Visual representation of ResNet-inspired model in extrapolation experiment. Plot presents in vivo metformin plasma concentrations predicted by model and the observed concentrations. Data for immediate-release tablets (IR) are presented in blue, whereas data for extended-release tablets (XR)are in green. Circle symbols were used for training data points and triangles for the test data points, which predominantly represent the later time points deliberately excluded during training to assess extrapolation capability.

Similar articles

References

    1. Anand O., Yu L.X., Conner D.P., Davit B.M. Dissolution Testing for Generic Drugs: An FDA Perspective. AAPS J. 2011;13:328–335. doi: 10.1208/s12248-011-9272-y. - DOI - PMC - PubMed
    1. Shrivas M., Khunt D., Shrivas M., Choudhari M., Rathod R., Misra M. Advances in In Vivo Predictive Dissolution Testing of Solid Oral Formulations: How Closer to In Vivo Performance? J. Pharm. Innov. 2020;15:296–317. doi: 10.1007/s12247-019-09392-6. - DOI
    1. Kostewicz E.S., Abrahamsson B., Brewster M., Brouwers J., Butler J., Carlert S., Dickinson P.A., Dressman J., Holm R., Klein S., et al. In Vitro Models for the Prediction of In Vivo Performance of Oral Dosage Forms. Eur. J. Pharm. Sci. 2014;57:342–366. doi: 10.1016/j.ejps.2013.08.024. - DOI - PubMed
    1. Butler J., Hens B., Vertzoni M., Brouwers J., Berben P., Dressman J., Andreas C.J., Schaefer K.J., Mann J., McAllister M., et al. In Vitro Models for the Prediction of in Vivo Performance of Oral Dosage Forms: Recent Progress from Partnership through the IMI OrBiTo Collaboration. Eur. J. Pharm. Biopharm. 2019;136:70–83. doi: 10.1016/j.ejpb.2018.12.010. - DOI - PubMed
    1. Zaborenko N., Shi Z., Corredor C.C., Smith-Goettler B.M., Zhang L., Hermans A., Neu C.M., Alam M.A., Cohen M.J., Lu X., et al. First-Principles and Empirical Approaches to Predicting In Vitro Dissolution for Pharmaceutical Formulation and Process Development and for Product Release Testing. AAPS J. 2019;21:32. doi: 10.1208/s12248-019-0297-y. - DOI - PMC - PubMed

LinkOut - more resources