

A Comprehensive Bibliometric Analysis of Biomedical Research Waste: Current Situation, Development, and Trends
- PMID: 40574270
- PMCID: PMC12211405
- DOI: 10.12659/MSM.948390
A Comprehensive Bibliometric Analysis of Biomedical Research Waste: Current Situation, Development, and Trends
Abstract
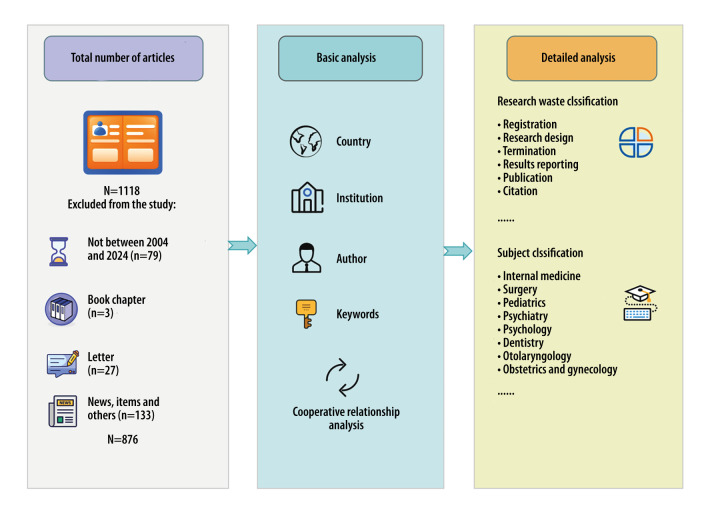
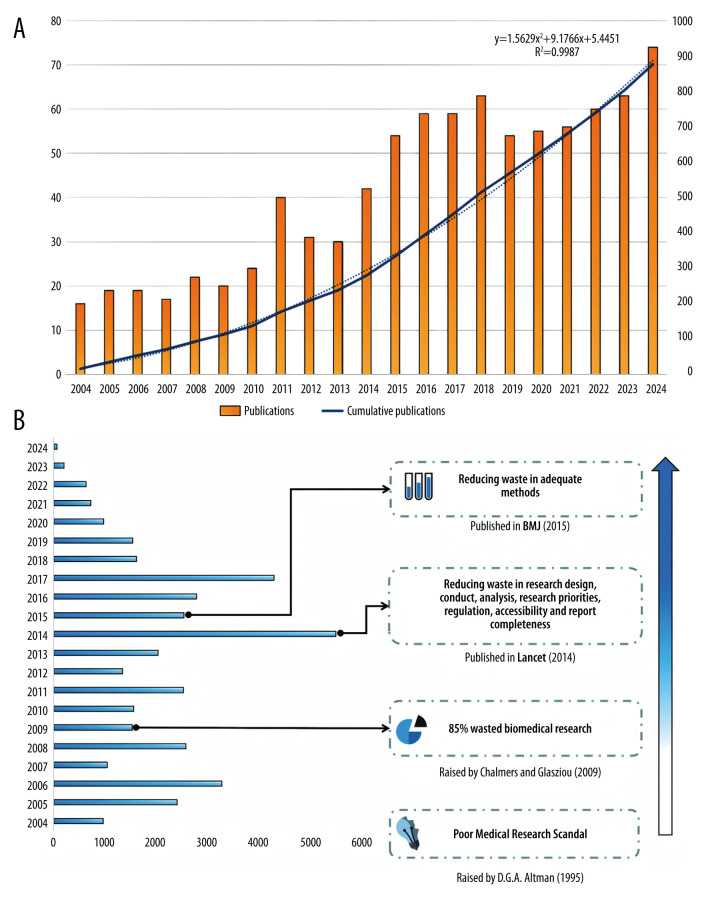
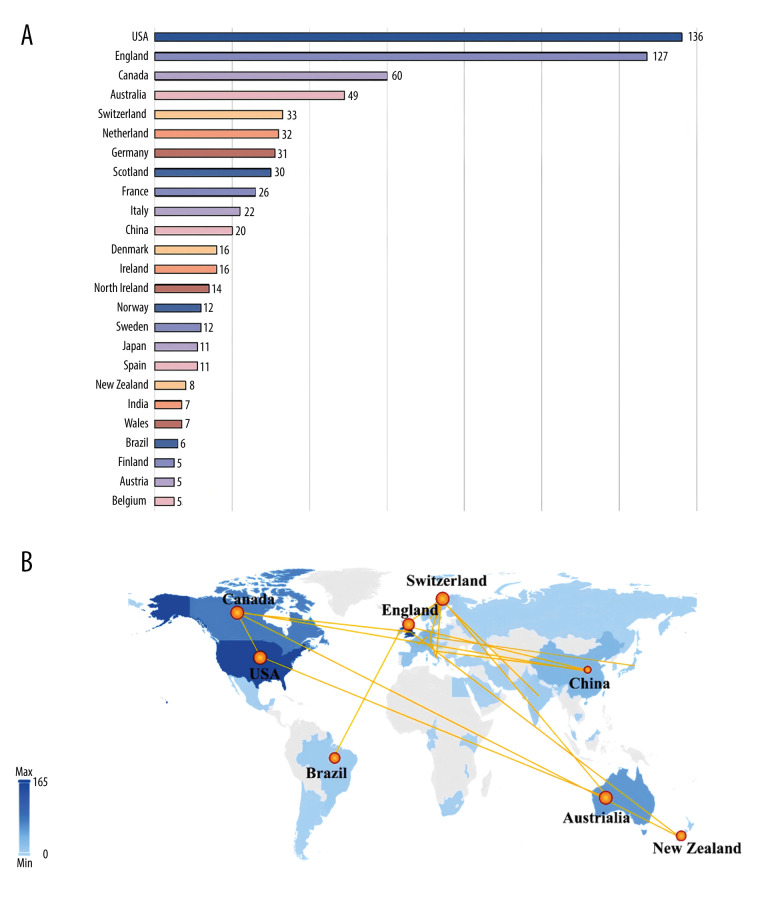
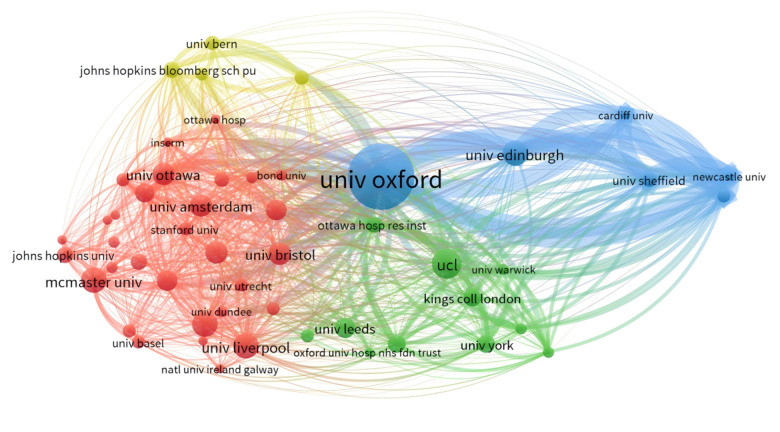
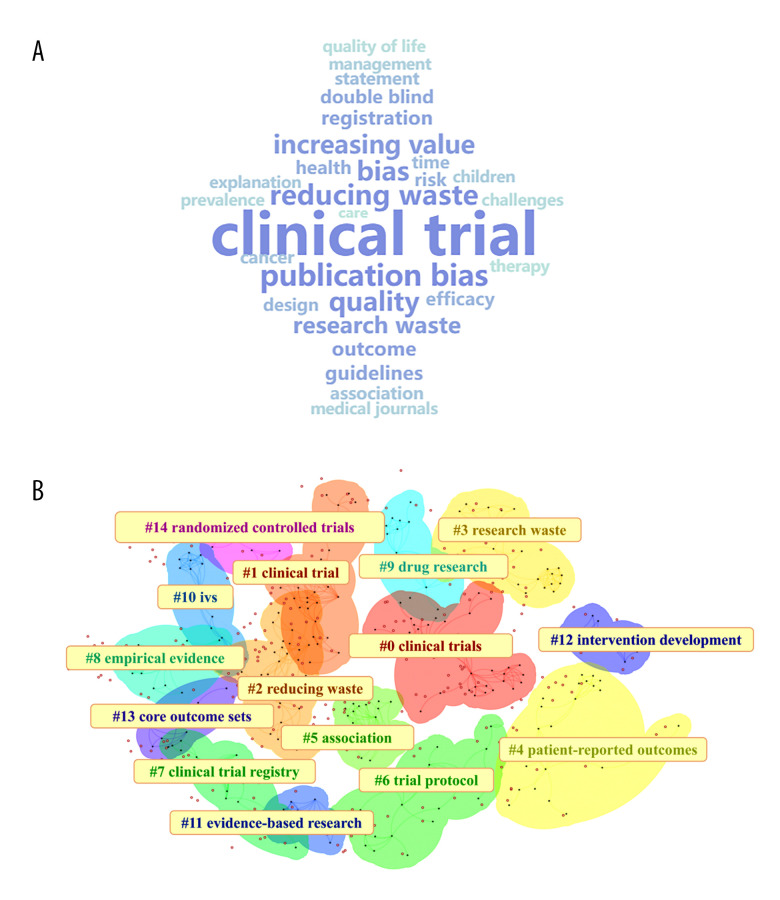
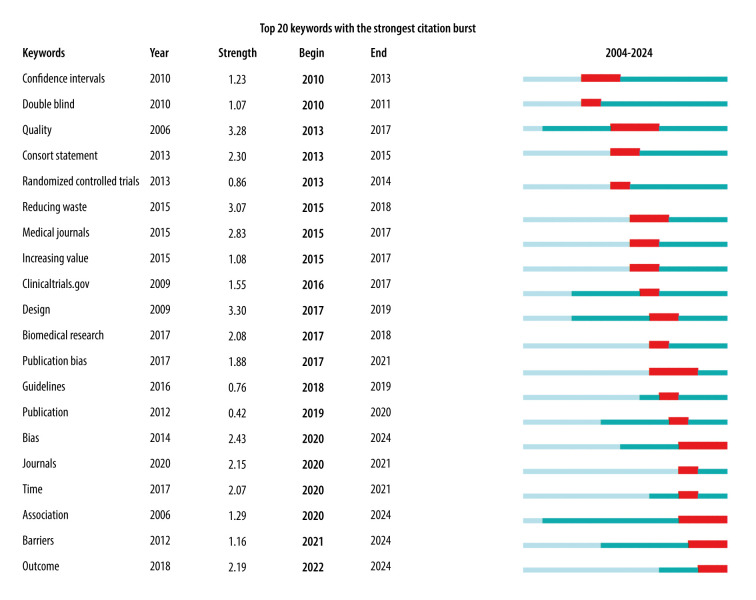
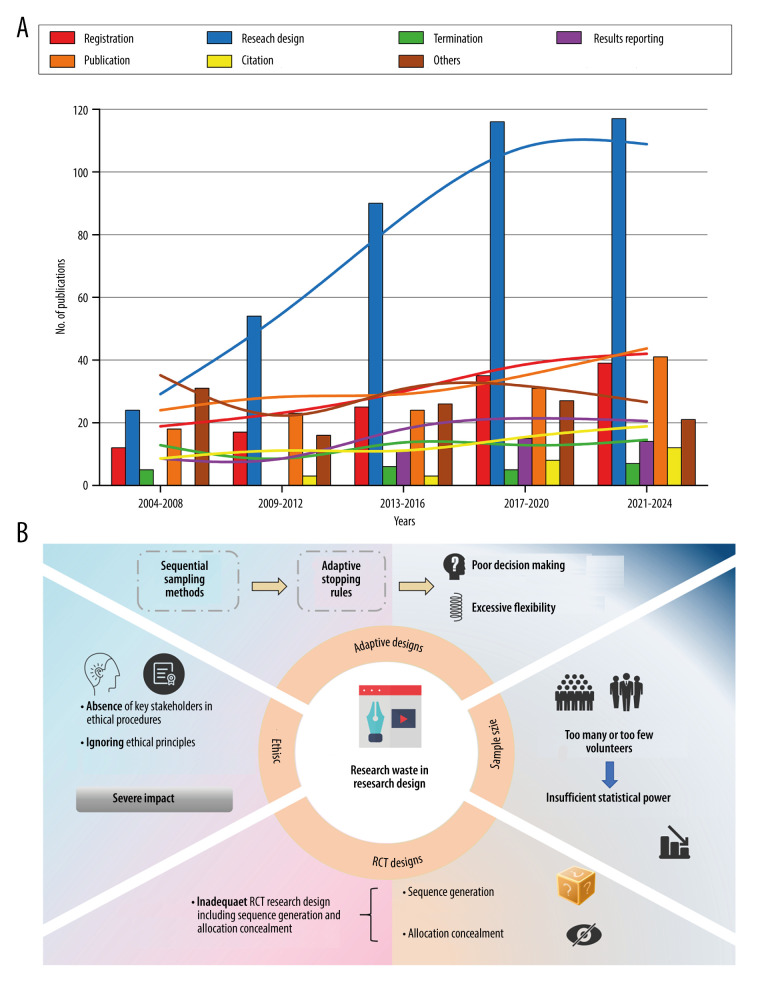
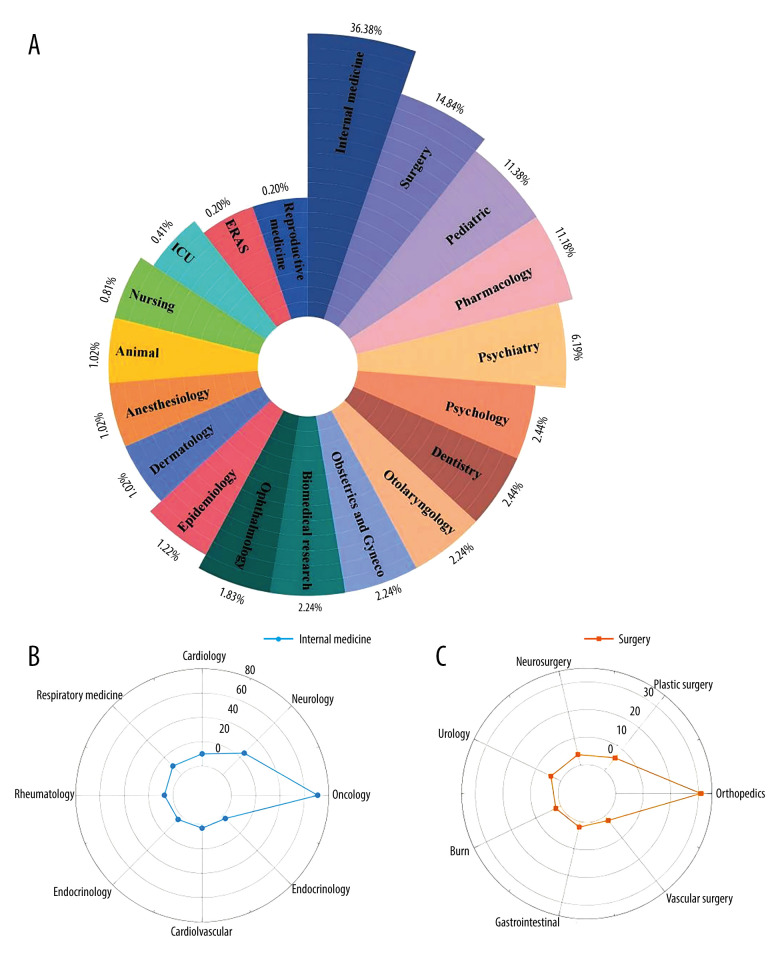
Since the 20th century, the rapid increase in academic publications has turned research waste into a significant challenge in scientific research. However, there is currently no comprehensive bibliometric analysis available to evaluate the progress in this field. In this study, we retrieved all relevant articles published between January 1, 2004, and December 31, 2024, from the Web of Science (WoS) database, yielding a total of 876 articles. Various tools, including CiteSpace, VOSviewer, and R-bibliometrix, were employed for comprehensive analysis. The results revealed that these articles collectively received 39 768 citations, with an average of 45.4 citations per paper. Both the number of published articles and the growth rate saw a rapid increase after 2014. The United States and the England emerged as the leading countries in research output. A keyword analysis identified 3 main themes: (1) the types of trials where research waste is most prevalent, (2) the primary factors contributing to research waste in trials, and (3) strategies to mitigate research waste. Notably, the experimental design phase has been identified as the primary source of research waste. Additionally, research waste was most prevalent in internal medicine, followed by surgery and pediatrics. Through these analyses, we provide valuable insights into the characteristics of research waste over the past 2 decades, highlighting an increased focus on this issue in the future.
Conflict of interest statement
Figures
Similar articles
-
Comprehensive Global Analysis of Future Trends in Artificial Intelligence-Assisted Veterinary Medicine.Vet Med Sci. 2025 May;11(3):e70258. doi: 10.1002/vms3.70258. Vet Med Sci. 2025. PMID: 40145983 Free PMC article.
-
Research status, hotspots and perspectives of artificial intelligence applied to pain management: a bibliometric and visual analysis.Updates Surg. 2025 Jun 28. doi: 10.1007/s13304-025-02296-w. Online ahead of print. Updates Surg. 2025. PMID: 40580377
-
Driving innovations in cancer research through spatial metabolomics: a bibliometric review of trends and hotspot.Front Immunol. 2025 Jun 10;16:1589943. doi: 10.3389/fimmu.2025.1589943. eCollection 2025. Front Immunol. 2025. PMID: 40557160 Free PMC article.
-
Scientific productivity in the field of rhinoplasty: A bibliometric analysis on global trends and regional contributions.Ann Chir Plast Esthet. 2025 Jul 2:S0294-1260(25)00079-2. doi: 10.1016/j.anplas.2025.05.016. Online ahead of print. Ann Chir Plast Esthet. 2025. PMID: 40610251
-
A bibliometric review and visualization of research on myocardial ischemia/reperfusion injury in patients with diabetes mellitus from 2004 to 2024.Medicine (Baltimore). 2025 May 30;104(22):e42707. doi: 10.1097/MD.0000000000042707. Medicine (Baltimore). 2025. PMID: 40441190 Free PMC article. Review.
References
-
- Moher D, Glasziou P, Chalmers I, et al. Increasing value and reducing waste in biomedical research: who’s listening? Lancet. 2016;387(10027):1573–86. - PubMed
-
- Chalmers I, Bracken MB, Djulbegovic B, et al. How to increase value and reduce waste when research priorities are set. Lancet. 2014;383(9912):156–65. - PubMed
-
- Ivers NM, Grimshaw JM. Reducing research waste with implementation laboratories. Lancet. 2016;388(10044):547–48. - PubMed
MeSH terms
LinkOut - more resources
Full Text Sources
Miscellaneous
