. 2025 Sep 1;214(9):2385-2396.
doi: 10.1093/jimmun/vkaf132.

The role of VISTA engagement in limiting neutrophil-mediated inflammation

Affiliations

The role of VISTA engagement in limiting neutrophil-mediated inflammation

Elizabeth C Nowak et al. J Immunol. .

Abstract

A growing body of evidence suggests that the immune checkpoint inhibitory receptor VISTA plays a central role in the regulation of innate immunity in the settings of inflammatory diseases and cancer. Neutrophils are among the cells that have the highest membrane density of surface VISTA. In this study, targeting VISTA on neutrophils with a monoclonal antibody resulted in a striking reduction in their lipopolysaccharide (LPS)- and chemokine-induced peripheral accumulation but did not reduce neutrophil levels at steady state. Fc receptor engagement and macrophages were required for the effects of anti-VISTA antibody on neutrophils. Concomitant with reduced peripheral neutrophil numbers, targeting VISTA increased neutrophil clearance by macrophages in the liver. In a murine model of neutrophil-mediated arthritis, anti-VISTA antibody treatment ameliorated disease severity, which was associated with reduced myeloperoxidase activity in the joints. These studies identify a novel therapeutic opportunity for targeting VISTA to control neutrophil-mediated inflammation and tissue injury.

Keywords: VISTA; immune checkpoint; inflammation; neutrophils.


Conflict of interest statement

None declared.

Figures
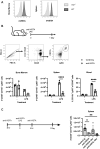
Figure 1.
Figure 1.
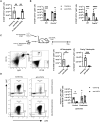
Treatment with anti-VISTA antibody suppresses LPS-induced neutrophil accumulation in the periphery. (A) Representative histograms show mouse VISTA (mVISTA) expression on bone marrow and spleen neutrophils (CD45+CD11b+Ly6G+) from WT (B6) mice (black line and dark grey shading). Control staining (light grey line and shading) is from the indicated tissue of a Vsir−/− mouse. (B) B6 mice were treated i.p. with LPS (10 µg) or vehicle and anti-VISTA or control antibodies (200 µg). Dot plots show representative neutrophil gating strategy in spleen. Graphs show mean ± SD live neutrophil numbers (bone marrow and spleen) and frequency (blood) in mice 1 day after antibody treatment and LPS. Data are representative of 2 experiments: n = 3 to 4 mice/group. (C) B6 mice were treated i.p. with LPS (10 µg) and anti-VISTA or control Ig (200 µg) at the time of LPS administration (anti-VISTA), 6 hr before LPS (anti-VISTA -6h), or 6 hr after LPS (anti-VISTA +6 h). Graph shows mean ± SD with n = 4-5 mice/group. Asterisks indicate statistically significant comparisons determined by (B) 2-way ANOVA with Sidak’s multiple comparison’s test or (C) 1-way ANOVA with Tukey’s multiple comparisons test: * P < 0.05, **** P < 0.0001. (C).
Figure 2.
Figure 2.
VISTA expression on neutrophils is required for anti-VISTA antibody to suppress LPS induced neutrophil accumulation in the periphery. (A) Histograms of VISTA expression on neutrophils (CD45+CD11b+Ly6G+) from Vsir−/− (shaded area), Vsirfl/fl (solid line), and S100a8cre  Vsirfl/fl (dashed line) are shown from bone marrow and spleen. (B) Mice were treated with anti-VISTA or control antibody and LPS as in Fig. 1 and analyzed on day 1 after treatment to determine the number (bone marrow and spleen) and frequency (blood) of live neutrophils (n = 3 to 5 mice/group). Data are representative of 2 experiments. Graph shows mean ± SD and the result of a two-way ANOVA and Sidak’s multiple comparisons test. Asterisks indicate statistically significant comparisons: * P < 0.05 and ** P < 0.01.
Figure 3.
Figure 3.
FcRγ engagement and macrophages are required for anti-VISTA antibody to suppress LPS-induced neutrophil accumulation in the periphery. (A) Splenic neutrophil numbers was assessed 1 d post LPS treatment in human VISTA knock-in (hVISTAKI) mice treated with anti-VISTA or control antibodies. Data are representative of 2 independent experiments with n = 3-4 mice/group. (B) Wild-type (B6), Fcer1g−/−, and Fcgr2b−/− mice were treated with the anti-VISTA or control antibody and LPS as in Fig. 1. Live splenic neutrophil numbers were quantified 1 day later. Data are representative of 2 independent experiments with n = 5 mice/group. (C) Neutrophils from the bone marrow of wild-type and Fcer1g−/− mice were isolated, labeled with CFSE or CellTrace Violet, and injected i.v. into wild-type recipients. Recipient mice were then treated with the anti-VISTA or control antibody and LPS. Plots show gating strategy from live singlet cells, and graphs show numbers of neutrophils recovered in the spleen from each transferred population. Data are representative of 3 independent experiments with n = 3 to 4 mice/group. (D) Mice were treated daily with 1 mg/mouse of clodronate or control liposomes (200 µl) for 4 consecutive days prior to anti-VISTA or control antibody and LPS i.p. Representative flow cytometry neutrophil gates are shown for each group. Graphs show the mean ± SD of neutrophil numbers (spleen) with n = 4 to 5 mice/group. All graphs show mean ± SD. Statistical significance was defined by (A) 1-way ANOVA with Tukey’s multiple comparisons test, (B, D) two-way ANOVA and Sidak’s multiple comparisons test, and (C) Student t-test. Asterisks indicate statistically significant comparisons: * P < 0.05, ** P < 0.01, *** P < 0.001, and **** P < 0.0001.
Figure 4.
Figure 4.
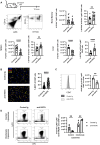
Treatment with anti-VISTA antibody in the presence of LPS increases neutrophil cell death and elimination in the liver that is dependent on macrophages. (A) B6 mice were treated i.p. with LPS (10 µg) and anti-VISTA or control antibodies (200 µg). Dot plots show example gating from CD45+ singlets. Graphs show live neutrophil numbers and percentage of SYTOX+ neutrophils in the bone marrow, spleen, and liver 12 h after treatment. Data are pooled from 3 independent experiments using a total of n = 12 to 13 mice/group. (B) Mice were treated as described in (A) and liver tissue was processed for histology (n = 4 mice/group). Tissue was stained for MPO (red), F4/80 (yellow), and DAPI (blue). Representative images from both groups are shown. Scale bars indicate 50 microns. MPO+ area and frequency of MPO+ in F4/80+ cells was determined using HALO software analyzing 20 images/mouse. (C) Representative histograms and quantification of CD47 expression on liver neutrophils (CD45+CD11b+Ly6G+) from LPS and control Ig or anti-VISTA mAb treated mice as in A. (D) Mice were treated daily with 1 mg/mouse of clodronate or control liposomes (200 µl) for 4 consecutive days prior to anti-VISTA or control antibody and LPS i.p. treatment. Representative flow cytometry neutrophil gates are shown for each group. Graphs show the mean ± SD of neutrophil numbers (liver) with n = 4 to 5 mice/group. All graphs show mean ± SD and were analyzed using Student t-test (A, B, C) or 2-way ANOVA with Sidak’s multiple comparison test (D). Asterisks indicate statistically significant comparisons: * P < 0.05, ** P < 0.01 and **** P < 0.0001.
Figure 5.
Figure 5.
Treatment with anti-VISTA antibody reduces neutrophil response to CXCL2. Mice were treated with anti-VISTA or control antibody one hour before treatment with CXCL2 i.p. Live neutrophil numbers and percent SYTOX+ neutrophils were quantified in the indicated tissues one hour after CXCL2 injection. Data in (C) are pooled from 2 independent experiments: n = 8 mice/group. Statistical significance was determined by (A, B) one-way AVONA and Tukey’s multiple comparisons test and (C) Student t-test. Asterisks indicate statistically significant comparisons: * P < 0.05, ** P < 0.01, *** P < 0.001, and **** P < 0.0001.
Figure 6.
Figure 6.
Treatment with anti-VISTA antibody reduces the severity of K/BxN serum transfer arthritis. (A) Mice were injected with K/BxN serum on day 0 and anti-VISTA or control antibody on days 0, 2, 4, and 6. Disease severity was monitored over time. Data are representative of 3 experiments with n = 8 mice/group. Statistical significance was determined by 2-way ANOVA and Sidak’s multiple comparisons test. (B) Mice were treated as described in (A), injected with luminol, and imaged to visualize neutrophil myeloperoxidase activity 2 d post serum transfer. Naïve controls were age and sex-matched mice that were not treated with K/BxN serum and antibody. Myeloperoxidase flux in indicated regions is graphed. Data were pooled from 2 independent experiments: n = 5 to 13 mice/group. Statistics show the result of a 1-way ANOVA and Tukey’s multiple comparisons test. Asterisks indicate statistically significant comparisons: * P < 0.05, ** P < 0.01, and *** P < 0.001.

References

    1. Kolaczkowska E, Kubes P. Neutrophil recruitment and function in health and inflammation. Nat Rev Immunol. 2013;13:159–175. - PubMed
    1. Mayadas TN, Cullere X, Lowell CA. The multifaceted functions of neutrophils. Annu Rev Pathol. 2014;9:181–218. - PMC - PubMed
    1. Rosales C. Neutrophil: a cell with many roles in inflammation or several cell types? Front Physiol. 2018;9:113. - PMC - PubMed
    1. Silvestre-Roig C, Hidalgo A, Soehnlein O. Neutrophil heterogeneity: implications for homeostasis and pathogenesis. Blood. 2016;127:2173–2181. - PubMed
    1. Fournier BM, Parkos CA. The role of neutrophils during intestinal inflammation. Mucosal Immunol. 2012;5:354–366. - PubMed