. 2025 Jul 1;18(7):dmm052243.
doi: 10.1242/dmm.052243. Epub 2025 Aug 1.

Dhdds T206A and Dhdds K42E knock-in mouse models of retinitis pigmentosa 59 are phenotypically similar

Affiliations

Dhdds T206A and Dhdds K42E knock-in mouse models of retinitis pigmentosa 59 are phenotypically similar

Mai N Nguyen et al. Dis Model Mech. .

Abstract

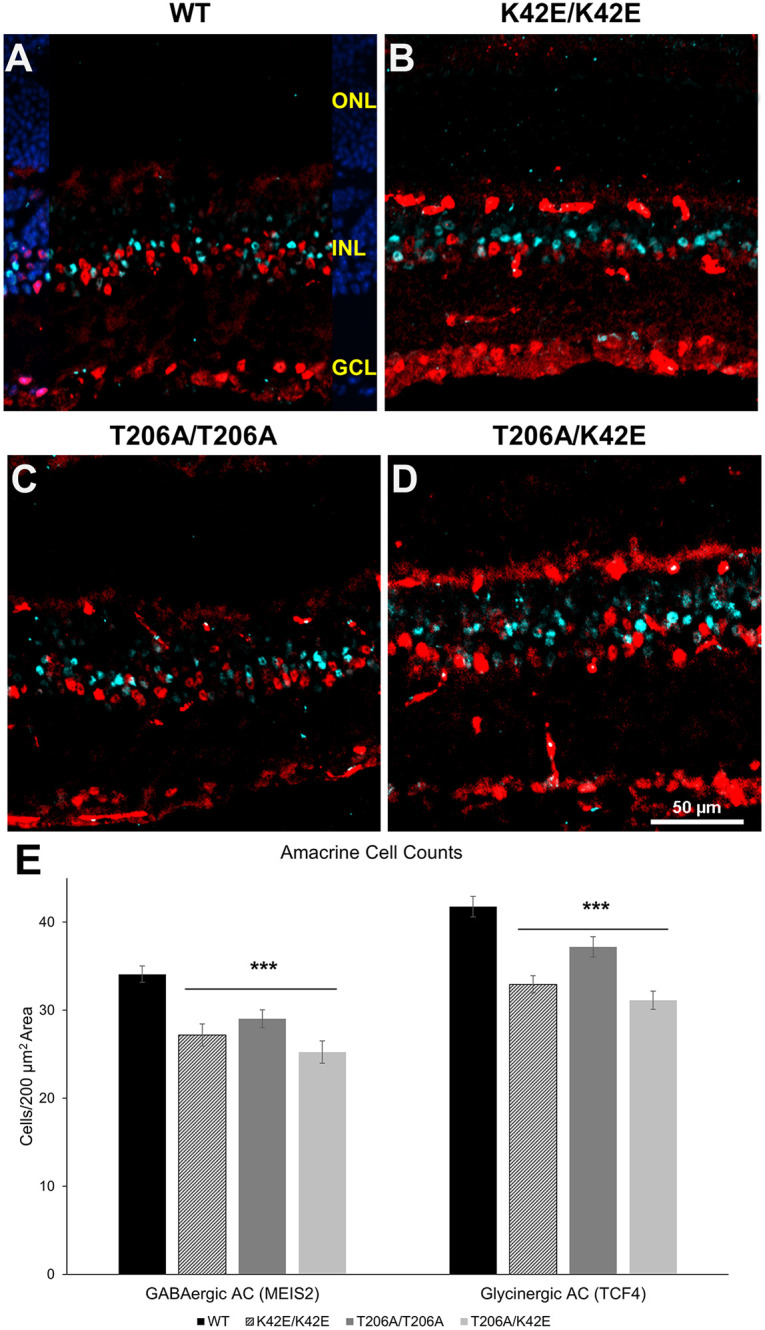
Dehydrodolichyl diphosphate synthase complex subunit (DHDDS) is required for protein glycosylation in eukaryotes, and variants. Surprisingly, three variant alleles (K42E/K42E, T206A/K42E and R98W/K42E) have been reported to cause retinitis pigmentosa 59 (RP59). Because T206A only has been reported to occur heterozygously with K42E, we generated homozygous and hererozygous mutants - i.e. T206A/T206A and T206A/K42E, respectively - in mice to assess the effect of the T206A allele. By postnatal age of 12 month (PN 12-mo), T206A/T206A and T206A/K42E mice exhibited reduction of inner nuclear layer thickness as observed in K42E/K42E mice. Electroretinography (ERG) revealed a reduction in b-waves, but spared reduction in a-wave amplitudes. By PN 3-mo, ERG c- and d-waves were significantly attenuated in all phenotypes. Consistent with a reduction in inner nuclear layer thickness as seen by using optical coherence tomography (OCT), cell loss observed by histology, as well as bipolar and amacrine cell densities were reduced in all Dhdds mutant phenotypes compared to those of PN 8-12 mo age-matched controls. These results indicated that the DHDDS T206A allele, like the K42E allele, causes retinal disease, probably through a common pathobiological mechanism. We propose that the physiological basis of retinal dysfunction in RP59 involves defective photoreceptor to bipolar cell synaptic transmission with concomitant bipolar/amacrine cell degeneration.

Keywords: Dolichol; Glycosylation; Inherited retinal degeneration; Mouse models; RP59; Retinitis pigmentosa.


Conflict of interest statement

Competing interests The authors declare no competing or financial interests.

Figures

Fig. 1.
Fig. 1.
Verification of T206A knock-in mutation. (A) Simple schematic representation of the DHDDS gene, showing its nine exons, with the adenine-thymine-guanine (ATG) start codon in exon 2, Lys42Glu (K42E) is contained within exon 3, Arg98Trp (R98W) is contained within exon 4, Thr206Ala (T206A) is contained within exon 6; the stop codon in exon 9 is indicated by an asterisk (*). K42 and T206 flank the catalytic binding sites, including a single Mg2+ ion per subunit and multiple isopentenyl units (Bar-El et al., 2020). (B) DNA sequence of a tail sample from an F0 founder mouse, showing the adenine-to-guanine (A-to-G) T206A variant (black arrow) as well as a (cytosine-to-adenine) C-to-A silent heterozygous polymorphism to remove the CRISPR-related PAM recognition site.
Fig. 2.
Fig. 2.
Retinal histology. (A,B) Light micrographs of mouse retina obtained from WT, T206A/T206A, T206A/K42E or K42E/K42E mice are shown for younger (PN≤6-mo) (A) and older animals (PN≥12-mo) (B) animals. Previously published K42E/K42E micrographs (Nguyen et al., 2023) were added for comparison. Figure adapted from Nguyen et al., 2023 under the terms of the CC-BY 4.0 license. Thickness of the INL is reduced in mutant strains. Arrows indicate ectopic migration of cells from the ONL into the OPL and INL. RPE, retinal pigment epithelium; OS, outer segment layer; IS, inner segment layer; ONL, outer nuclear layer; OPL, outer plexiform layer; INL, inner nuclear layer; IPL, inner plexiform layer; GCL; ganglion cell layer. Scale bar: 50 µm, all panels.
Fig. 3.
Fig. 3.
Measurements of total retinal thickness and INL thickness obtained using SD-OCT. (A,B) Representative SD-OCT images obtained from WT, T206A/WT, T206A/T206A or T206A/K42E at PN 1-mo (A) and PN 12-mo (B). (C,D) Analysis of the total retinal thickness (indicated by the vertical white line shown in the top left image) (C) and thickness of the inner nuclear layer (INL) (D). Plotted are the averaged data obtained from mice at PN 1-mo (black) and PN 12-mo (grey). Previously published data obtained from K42E/K42E mice (see Nguyen et al., 2023) have been included for reference in panels C and D. Figure adapted from Nguyen et al., 2023 under the terms of the CC-BY 4.0 license. IPL, inner plexiform; ONL, outer nuclear layer. Scale bar: 0.1 µm for all panels. Statistical significance: ***P≤0.0001; n=4 (WT); n=3 (T206A/WT, T206A/T206A and T206A/K42E).
Fig. 4.
Fig. 4.
ERG b/a-wave amplitude ratios. (A,B) Representative graphs showing dark-adapted (DA) (A) and light-adapted (LA) (B) waveforms obtained from WT. T206A/T206A or T206A/K42E mice at PN 6-mo. (C,D) Plotted b/a ratios taken at PN 1-, 3-, 6- and 12-mo time points under DA (C) and LA (D) conditions are shown for mice as in A,B. All mutant mouse b/a ratio comparisons within each time point were made in relation to WT values. WT (solid black line), T206A/WT (dashed/dotted grey line), T206A/T206A (dotted grey line), T206A/K42E (dashed grey line). The negative b-wave ERG threshold is indicated by the straight horizontal dashed line at b/a=1. (E,F) Implicit time (time-to-peak) measurements for DA (E) and LA (F) a- and b-waves of for mice as in A,B at PN 1- and PN 12-mo are compared to those for WT. (G,H) Oscillatory potential (OP) measurements for DA (G) and LA (H) waveforms obtained from K42E/K42E, T206A/T206A and T206A/K42E mice at PN 12-mo compared to those of WT mice. Statistical significance: *P<0.05, **P<0.01, and ***P≤0.001. Animal numbers varied from n=6–14.
Fig. 5.
Fig. 5.
ERG c- and d-wave amplitudes. (A) Representative PN 6-mo waveforms for c- and d-waves are shown. Black arrowheads indicate measurement of d-wave amplitudes; horizontal bar indicates 5000 ms stimulus on (white bar) and stimulus off (black bar). (B,C) Plotted are measurements of c-wave amplitudes (B) and d-wave amplitudes (C) at PN 1-, 3-, 6-, and 12-mo for mice as indicated compared to those of WT mice. Statistical significance: *P≤0.05. c-waves, (WT, T206A/WT, T206A/T206A, T206A/K42E): PN 1-mo (n=9, 8, 8, 8); PN 3-mo (n=9, 9, 9, 8); PN 6-mo (n=7, 8, 8, 6); PN 12-mo (n=8, 7, 7, 8); d-waves: PN 1-mo (n=8, 8, 8, 8); PN 3-mo (n=9, 9, 9, 9); PN 6-mo (n=7, 8, 8, 7); PN 12-mo (n=8, 7, 8, 8).
Fig. 6.
Fig. 6.
Bipolar cell densities. (A-P) Shown are representative 200 µm×200 µm images of retinal tissue sections obtained from WT (column 1, panels A,E,I,M), K42E/K42E (column 2, panels B,F,J,N), T206A/T206A (column 3, panels C,G,K,O) or T206A/K42E (column 4, panels, D,H,L,P) mice. Rod bipolar cells (RBs) labeled with PKC-α are shown in green (A-D). All bipolar cells (All BPs) labeled with anti-CHX10 are shown in red (E-H). All-ON- bipolar cells (All ON-BCs) labeled with anti-ISL1 are shown in cyan (I-L). Merged images are shown in panels M-P; the DAPI panel overlay (blue) in M indicates the nuclear layers of the retina. Yellow arrowheads (D,H,L) represent puncta that were counted. White arrow in panel L indicates ISL1-positive blood vessels, which were excluded from bipolar cell counts. (Q) Averaged overall values for All BP, Rod BP, All ON-BP, ON-CB and OFF-CB cell counts per 200 µm×200 µm squares are plotted. RPE, retinal pigment epithelium; OS, outer segment layer; IS, inner segment layer; ONL, outer nuclear layer; OPL, outer plexiform layer; INL, inner nuclear layer; IPL, inner plexiform layer; GCL; ganglion cell layer. Scale bar: 50 µm for all panels. Statistical significance: *P≤0.05 and ***P≤0.001. n=3 for WT, K42E/K42E, T206A/T206A and T206A/K42E.
Fig. 7.
Fig. 7.
Amacrine cell densities. (A-D) Representative images of immunolabeled retinal tissue sections obtained from WT (A), K42E/K42E (B), T206A/T206A (C) and T206A/K42E (D) mice. GABAergic amacrine cell (AC) nuclei show immunolabeling for MEIS2 (pseudo-colored in red), glycinergic AC nuclei show immunolabeling for TCF4 (pseudo-colored in cyan). The DAPI (blue) panel overlay in A indicates the nuclear layers of the retina. (E) Averaged overall values for GABAergic and glycinergic AC nuclei counts are plotted. ONL, outer nuclear layer; INL, inner nuclear layer; GCL; ganglion cell layer. Scale bar: 50 µm for all panels. Statistical significance: ***P≤0.001. n=3 for WT, K42E/K42E, T206A/T206A and T206A/K42E.
Fig. 8.
Fig. 8.
Visual acuity values at PN 12-mo. (A,B) The optokinetic response was used to determine the highest spatial frequency and visual acuity for WT, T206A/T206A, and T206A/K42E mice at PN 12-mo under light-adapted (A) or dark-adapted (B) conditions. c/d, cycles per degree. Statistical significance: *P≤0.05 and **P≤0.01. n≤3 for WT, T206A/T206A and T206A/K42E.

Update of

Similar articles

References

    1. Aebi, M. (2013). N-linked protein glycosylation in the ER. Biochim. Biophys. Acta Mol. Cell Res. 1833, 2430-2437. 10.1016/j.bbamcr.2013.04.001 - DOI - PubMed
    1. Ali, M. U., Rahman, M. S. U., Cao, J. and Yuan, P. X. (2017). Genetic characterization and disease mechanism of retinitis pigmentosa; current scenario. 3 Biotech 7, 251. 10.1007/s13205-017-0878-3 - DOI - PMC - PubMed
    1. Anders, C., Niewoehner, O., Duerst, A. and Jinek, M. (2014). Structural basis of PAM-dependent target DNA recognition by the Cas9 endonuclease. Nature 513, 569-573. 10.1038/nature13579 - DOI - PMC - PubMed
    1. Bar-El, M. L., Vaňková, P., Yeheskel, A., Simhaev, L., Engel, H., Man, P., Haitin, Y. and Giladi, M. (2020). Structural basis of heterotetrameric assembly and disease mutations in the human cis-prenyltransferase complex. Nat. Commun. 11, 5273. 10.1038/s41467-020-18970-z - DOI - PMC - PubMed
    1. Bhatt, Y., Hunt, D. M. and Carvalho, L. S. (2023). The origins of the full-field flash electroretinogram b-wave. Front. Mol. Neurosci. 16, 1153934. 10.3389/fnmol.2023.1153934 - DOI - PMC - PubMed

Substances

LinkOut - more resources