. 2025 Jul 1;81(Pt 7):357-379.
doi: 10.1107/S2059798325005303. Epub 2025 Jun 27.

Structural dynamics of IDR interactions in human SFPQ and implications for liquid-liquid phase separation

Affiliations

Structural dynamics of IDR interactions in human SFPQ and implications for liquid-liquid phase separation

Heidar J Koning et al. Acta Crystallogr D Struct Biol. .

Abstract

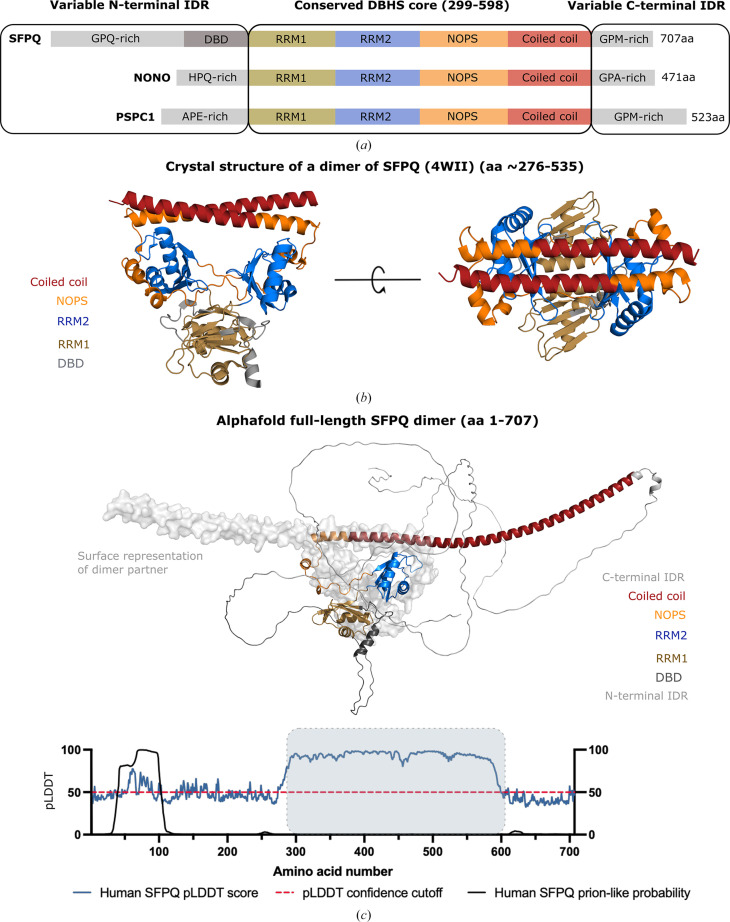
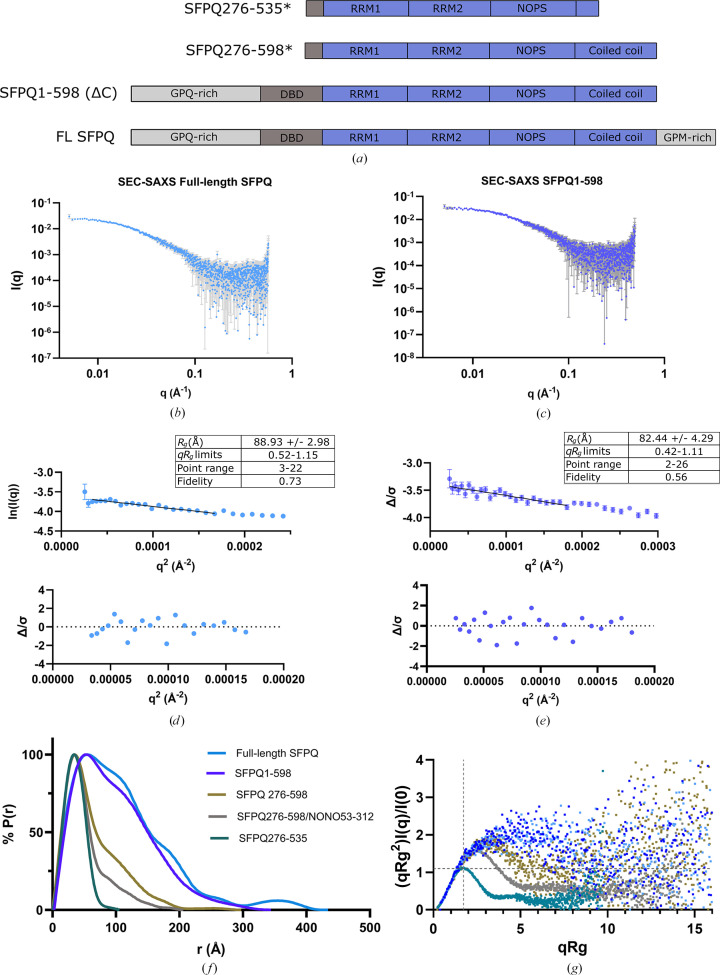
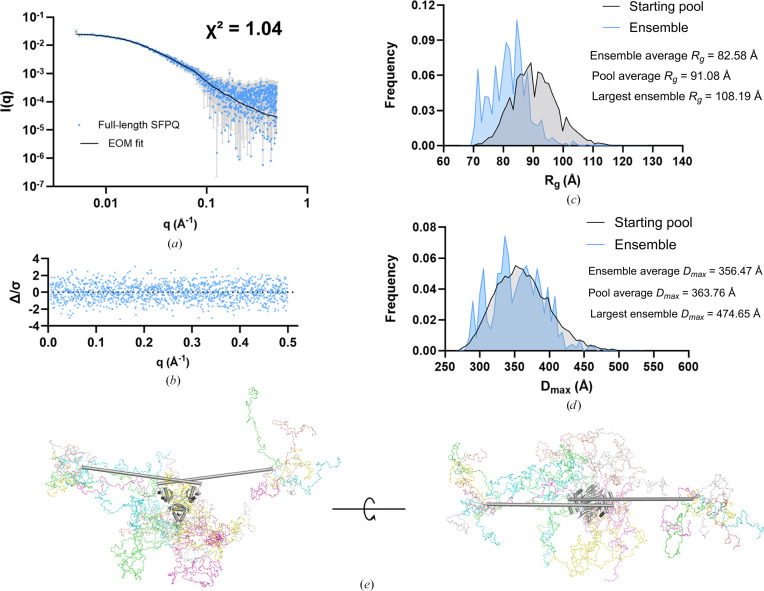
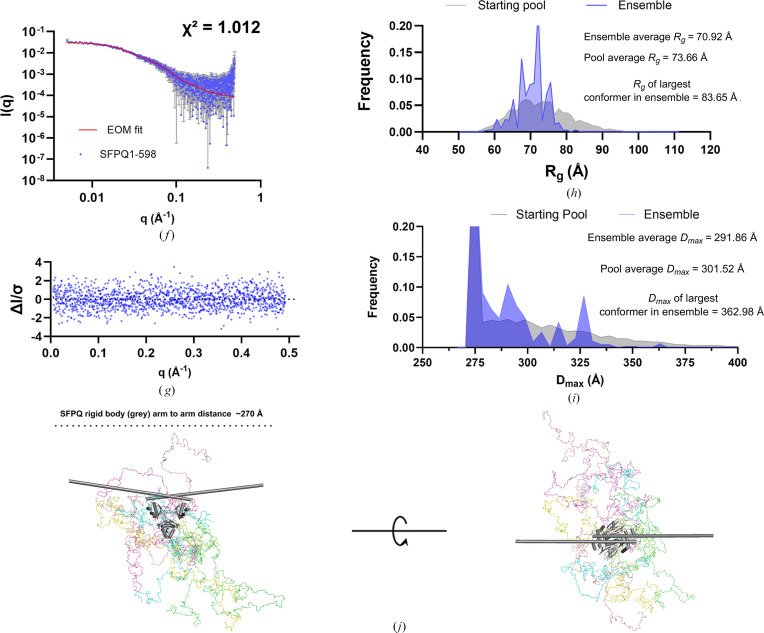
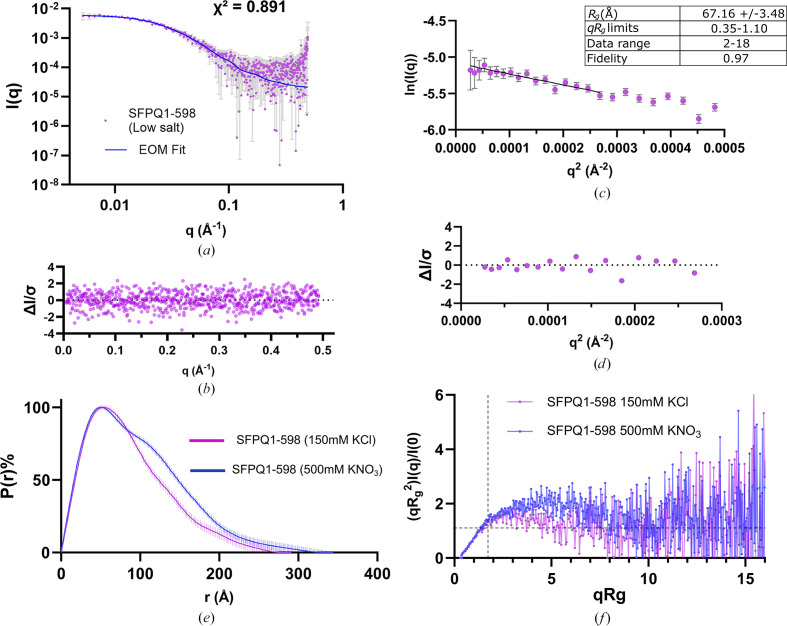
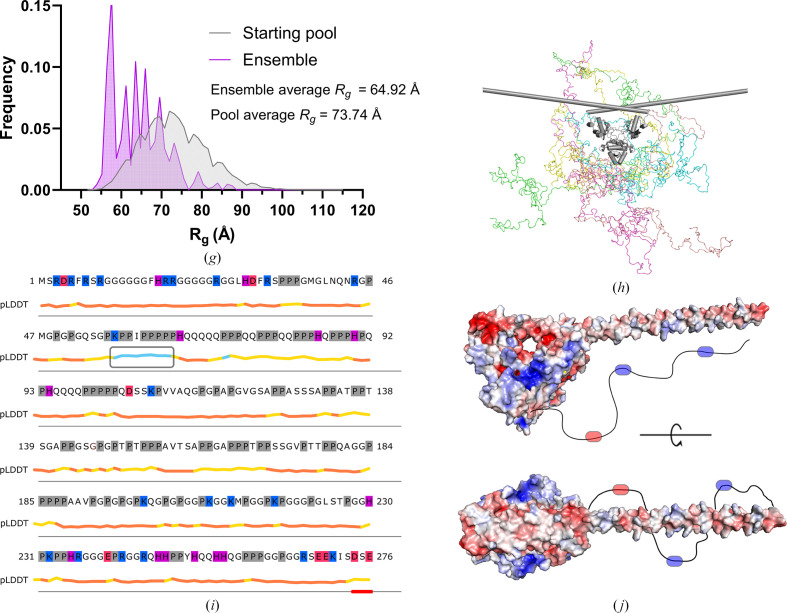
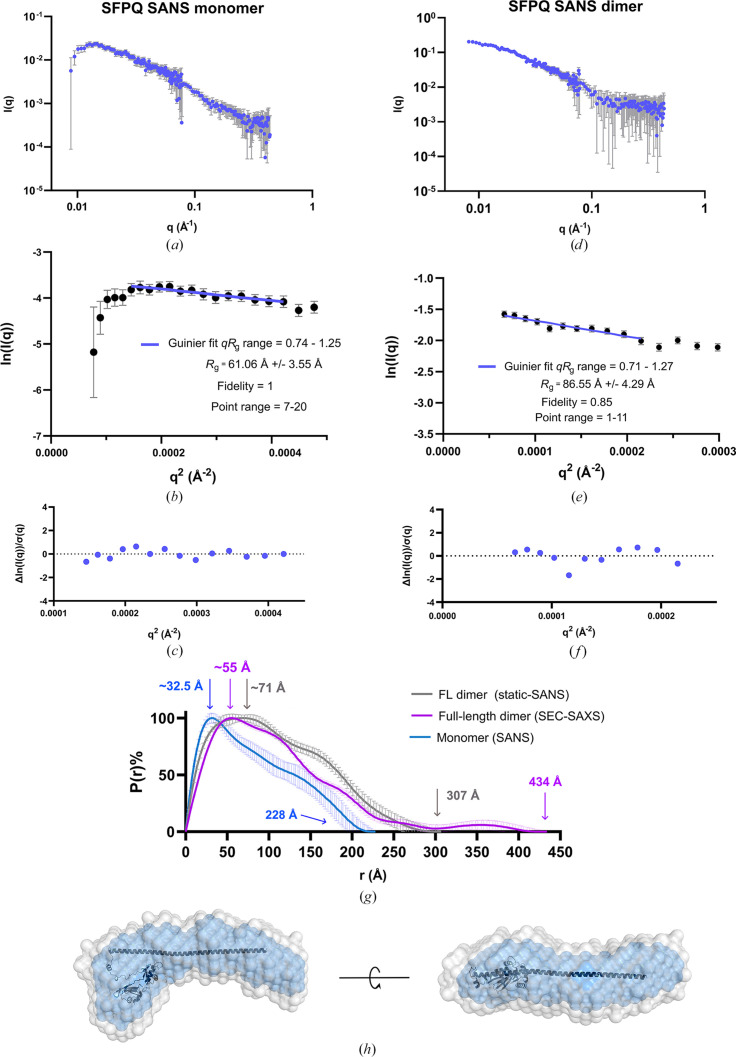
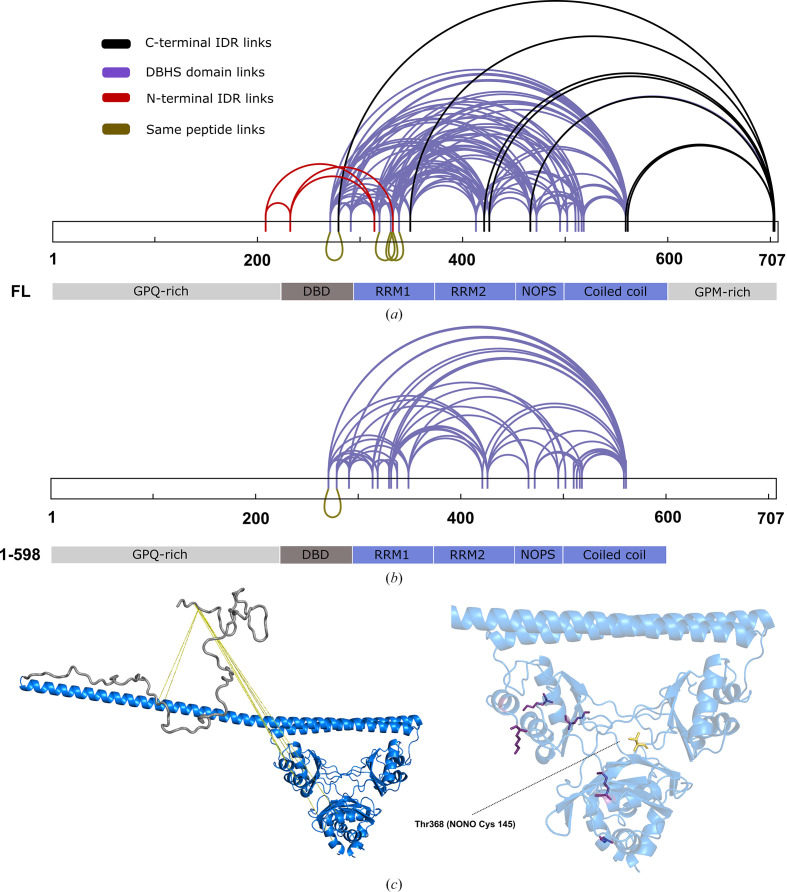
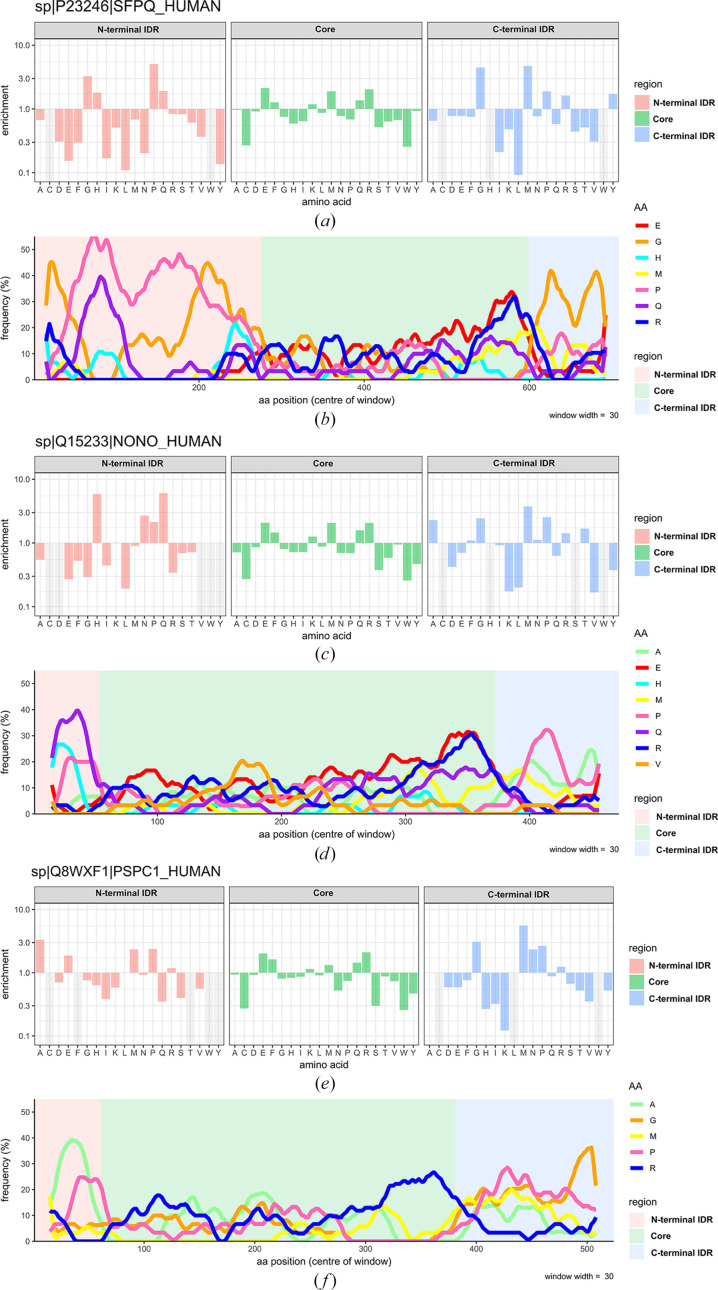
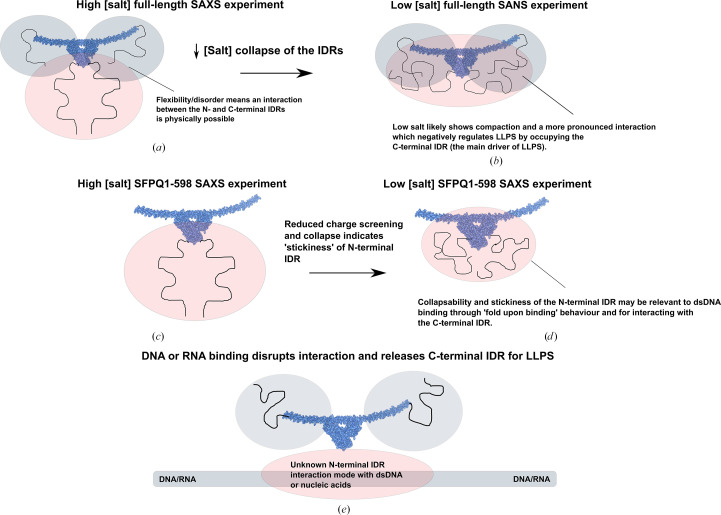
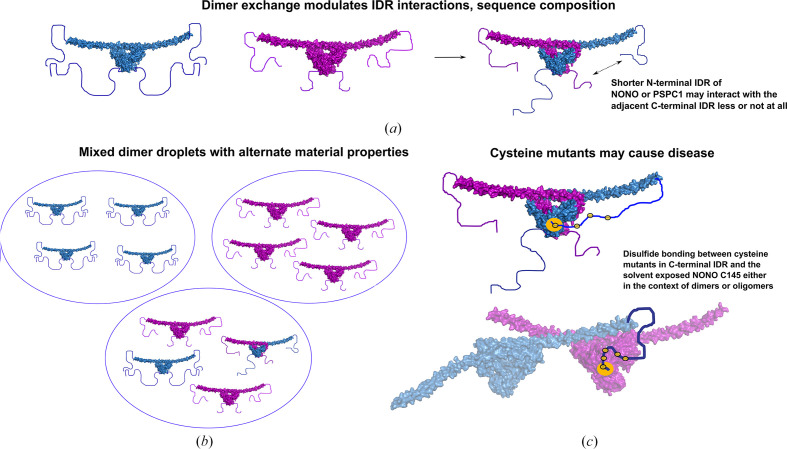
The proteins SFPQ (splicing factor proline- and glutamine-rich) and NONO (non-POU domain-containing octamer-binding protein) are members of the Drosophila behaviour/human splicing (DBHS) protein family, sharing 76% sequence identity in their conserved DBHS domain. These proteins are critical for elements of pre- and post-transcriptional regulation in mammals and are primarily located in paraspeckles: ribonucleoprotein bodies templated by NEAT1 long noncoding RNA. Regions that are structured and predicted to be disordered (IDRs) in DBHS proteins facilitate various interactions, including dimerization, polymerization, nucleic acid binding and liquid-liquid phase separation, all of which have consequences for cell health, the pathology of some neurological diseases and cancer. To date, very limited structural work has been carried out on characterizing the IDRs of the DBHS proteins, largely due to their predicted disordered nature and the fact that this is often a bottleneck for conventional structural techniques. This is a problem worth addressing, as the IDRs have been shown to be critical to the material state of the protein as well as its function. In this study, we used small-angle X-ray scattering (SAXS) and small-angle neutron scattering (SANS), together with lysine cross-linking mass spectrometry (XL-MS), to investigate the regions of SFPQ flanking the structured DBHS domain and the possibility of dimer partner exchange of full-length proteins. Our results demonstrate experimentally that the N- and C-terminal regions on either side of the folded DBHS domain are long, disordered and flexible in solution. Realistic modelling of disordered chains to fit the scattering data and the compaction of the different protein variants suggests that it is physically possible for the IDRs to be close enough to interact. The mass-spectrometry data additionally indicate that the C-terminal IDR can potentially interact with the folded DBHS domain and also shares some conformational space with the N-terminal IDR. Our small-angle neutron scattering (SANS) experiments reveal that full-length SFPQ is capable of swapping dimer partners with itself, which has implications for our understanding of the combinatorial dimerization of DBHS proteins within cells. Our study provides insight into possible interactions between different IDRs either in cis or in trans and how these may relate to protein function, and the possible impact of mutations in these regions. The dynamic dimer partner exchange of a full-length protein inferred from this study is a phenomenon that is integral to the function of DBHS proteins, allowing changes in gene-regulatory activity by altering levels of the various heterodimers or homodimers.

Keywords: DBHS; dimers; disorder; flexibility; phase separation.


Figures

Figure 1
Figure 1
The DBHS family, dimerization and disorder. (a) The domain map of the DBHS family indicates the conserved central DBHS region coloured by domain (gold for RRM1, blue for RRM2, orange for NOPS and red for the coiled-coil domain). The different IDRs and the DBD are coloured grey. (b) Side view and top view of the structure of an SFPQ homodimer (PDB entry 4wii; Lee et al., 2015 ▸). The protein variant was truncated to remove the extended coiled-coil domain and disordered regions. This structure has been coloured according to the domain map in (a). (c) Predicted AlphaFold2 (Mirdita et al., 2022 ▸) structure of human full-length SFPQ coloured according to the domain map in (a). One monomer in the dimer is shown as a cartoon representation and the other as a surface representation without IDRs for simplicity. Light grey regions are the N- and C-terminal IDRs represented as ‘barbed wire’ by AlphaFold. Below the predicted structure AlphaFold pLDDT and PLAAC prion-like probability (Lancaster et al., 2014 ▸) scores for human SFPQ as a function of amino-acid number are shown. A pLDDT score above ∼50 is a good indicator of structure and a score below ∼50 is indicative of disorder. A PLAAC score approaching 1 (100) is indicative of prion-like characteristics/sequence.
Figure 2
Figure 2
SAXS analysis of SFPQ containing IDRs in high-salt conditions. (a) Domain map indicating protein variants that have been analysed via SAXS. An asterisk denotes previously published data or data in the supporting information on variants of SFPQ or NONO. (b, c) SEC-SAXS scattering for full-length SFPQ and SFPQ1–598, respectively. (d, e) Guinier analysis for full-length SFPQ and SFPQ1–598, respectively; below, the normalized residuals plots of the Guinier fits. (f) Distance distribution functions calculated for all protein variants examined in this study. Functions have been normalized by % P(r) and error bars have been omitted for simplicity (but can be seen later in the study). (g) Dimensionless Kratky plot for all variants used in this study; variants are coloured according to the legend in (f).
Figure 3
Figure 3
Ensemble modelling of SFPQ using EOM: a potential N–C-terminal interaction. (a) SEC-SAXS scattering data of full-length SFPQ shown as log(I) versus log(q). The fit of the EOM ensemble is shown as a black line. The χ2 of 1.04 indicates an excellent fit to the data. (b) Normalized residual plot of the EOM fit to experimental data: the lack of systematic variation is indicative of a good fit. (c) Frequency versus Rg plot of the initial random starting pool and the ensembles that fit the data. (d) Frequency versus Dmax plot of the initial random starting pool and selected ensembles that fit the data. (e) Atomistic models of full-length SFPQ which are from the ensemble that fit the data. (f) SEC-SAXS scattering data of SFPQ1–598 as a log(I) versus log(q) plot. The fit of the EOM ensemble is shown as a red line. A χ2 of 1.012 indicates an excellent fit to the data. (g) Normalized residual plot of the EOM fit to the experimental data: the lack of systematic variation is indicative of a good fit. (h) Frequency versus Rg plot of the initial random pool and selected ensembles which fit the data. (i) Frequency versus Dmax plot of initial random pools and selected ensembles for SFPQ1–598. (j) Selection of models from the ensemble that fit the SFPQ1–598 data.
Figure 3
Figure 3
Ensemble modelling of SFPQ using EOM: a potential N–C-terminal interaction. (a) SEC-SAXS scattering data of full-length SFPQ shown as log(I) versus log(q). The fit of the EOM ensemble is shown as a black line. The χ2 of 1.04 indicates an excellent fit to the data. (b) Normalized residual plot of the EOM fit to experimental data: the lack of systematic variation is indicative of a good fit. (c) Frequency versus Rg plot of the initial random starting pool and the ensembles that fit the data. (d) Frequency versus Dmax plot of the initial random starting pool and selected ensembles that fit the data. (e) Atomistic models of full-length SFPQ which are from the ensemble that fit the data. (f) SEC-SAXS scattering data of SFPQ1–598 as a log(I) versus log(q) plot. The fit of the EOM ensemble is shown as a red line. A χ2 of 1.012 indicates an excellent fit to the data. (g) Normalized residual plot of the EOM fit to the experimental data: the lack of systematic variation is indicative of a good fit. (h) Frequency versus Rg plot of the initial random pool and selected ensembles which fit the data. (i) Frequency versus Dmax plot of initial random pools and selected ensembles for SFPQ1–598. (j) Selection of models from the ensemble that fit the SFPQ1–598 data.
Figure 4
Figure 4
Low-salt versus high-salt data comparison for SFPQ1–598. (a) SEC-SAXS scattering data of SFPQ1–598 shown as a log(I) versus log(q) plot. The fit of the EOM ensemble is shown as a blue line. The χ2 of 0.891 indicates an excellent fit to the data. (b) Normalized residual plot for the EOM fit indicating reasonable variation around the fit. (c) Guinier analysis indicates a linear fit within the appropriate qRg range and an Rg smaller than that for SFPQ1–598 in high salt. (d) The normalized residuals for Guinier analysis indicating reasonable variation of the data around the fit. (e) Distance distribution functions of SFPQ1–598 in both salt conditions. (f) Dimensionless Kratky analysis comparing SFPQ1–598 in high-salt and low-salt conditions. (g) Frequency versus Rg plot of initial random and selected ensemble pools. (h) Atomistic models from the ensemble that fits the data. (i) The sequence of the N-terminal IDR of SFPQ (residues 1–276) with charged/proline residues coloured by identity (histidine, purple; arginine and lysine, blue; aspartate and glutamate, red; proline, grey). The AlphaFold pLDDT score is shown beneath the sequence, with regions in orange and yellow having a low confidence score and regions in blue having a moderate–high confidence. (j) Electrostatic map of an SFPQ homodimer with one of the coiled-coil domains removed for space and simplicity. Blue shading shows positively charged pockets and red shading shows negatively charged pockets. The N-terminal IDR is represented as an unrealistic cartoon line with an alternating charge.
Figure 4
Figure 4
Low-salt versus high-salt data comparison for SFPQ1–598. (a) SEC-SAXS scattering data of SFPQ1–598 shown as a log(I) versus log(q) plot. The fit of the EOM ensemble is shown as a blue line. The χ2 of 0.891 indicates an excellent fit to the data. (b) Normalized residual plot for the EOM fit indicating reasonable variation around the fit. (c) Guinier analysis indicates a linear fit within the appropriate qRg range and an Rg smaller than that for SFPQ1–598 in high salt. (d) The normalized residuals for Guinier analysis indicating reasonable variation of the data around the fit. (e) Distance distribution functions of SFPQ1–598 in both salt conditions. (f) Dimensionless Kratky analysis comparing SFPQ1–598 in high-salt and low-salt conditions. (g) Frequency versus Rg plot of initial random and selected ensemble pools. (h) Atomistic models from the ensemble that fits the data. (i) The sequence of the N-terminal IDR of SFPQ (residues 1–276) with charged/proline residues coloured by identity (histidine, purple; arginine and lysine, blue; aspartate and glutamate, red; proline, grey). The AlphaFold pLDDT score is shown beneath the sequence, with regions in orange and yellow having a low confidence score and regions in blue having a moderate–high confidence. (j) Electrostatic map of an SFPQ homodimer with one of the coiled-coil domains removed for space and simplicity. Blue shading shows positively charged pockets and red shading shows negatively charged pockets. The N-terminal IDR is represented as an unrealistic cartoon line with an alternating charge.
Figure 5
Figure 5
SANS experiments indicating dimer partner exchange between SFPQ homodimers. (a) Log(I) versus log(q) plot for an experiment featuring ∼5% protiated SFPQ (hSFPQ) and 95% deuterated SFPQ (dSFPQ) at a D2O match-point of 95%. (b) Guinier plot for (a) indicating the qRg range of 0.74–1.25 with a Guinier Rg of 61.06 ± 3.55 Å. (c) Residual plot of the Guinier fit. (d) Log(I) versus log(q) plot for an experiment featuring ∼5% hSFPQ and 95% dSFPQ in H2O without any match-out. (e) Guinier plot for (d) indicating the qRg range of 0.71–1.27 with a Guinier Rg of 86.55 ± 4.29 Å. (f) Residual plot of the Guinier fit from (e). (g) A comparative P(r) function plot between full-length SFPQ as observed with SEC-SAXS and the SANS data from these experiments. Differing peak maxima, function shapes and Dmax values indicate that the blue curve corresponds to a monomer of full-length SFPQ. The differing maxima, Dmax values and overall changes in shape between the purple and grey functions may be evidence of the compaction of full-length SFPQ in different salt conditions. (h) DAMAVER (grey) and DAMFILT (blue) envelopes processed from the matched-out SANS data, with an atomistic model of a monomer of SFPQ including just the folded domain superposed over the envelope. This further confirms that the blue function in (g) corresponds to a monomer of SFPQ.
Figure 6
Figure 6
Lysine cross-linking indicates that the C-terminal and N-terminal IDRs make contact with the DBHS domain. (a) Lysine cross-links detected via mass spectrometry in full-length SFPQ at 0.7 mg ml−1 (10 µM). Cross-links are connected via a line across the amino-acid sequence. Black indicates links involving the C-terminal IDR, purple indicates cross-links within the DBHS domain, red indicates cross-links involving the N-terminal IDR and gold indicates cross-links between the same peptide. (b) Cross-links detected for SFPQ1–598 (20 µM). (c) The DBHS domain is coloured marine and the C-terminal IDR is coloured grey; points of contact are indicated by a yellow line between the DBHS domain, the coiled-coil domain and the C-terminal IDR. The enlarged DBHS dimer indicates lysines involved in cross-linking (purple). The equivalent position of NONO C145 (Thr368 in SFPQ) has been highlighted in yellow. This may form disulfides with disease-associated cysteine mutants in the C-terminal IDRs of DBHS proteins (see Section 4.4).
Figure 7
Figure 7
Comparative amino-acid enrichment profiles of the human DBHS paralogs across N-terminal and C-terminal IDRs and the DBHS domain. (a) Amino-acid enrichment and depletion histogram of the N- and C-terminal IDRs and the DBHS domain of SFPQ. DBHS sequences are mapped against the average enrichment and depletion of amino acids in the human proteome. (b) Amino-acid frequency analysis of the N- and C-terminal IDRs and the DBHS domain of SFPQ using a sliding window of 30 amino acids. (c) Amino-acid enrichment and depletion histogram of the N-terminal and C-terminal IDRs and the DBHS domain of NONO mapped against the average enrichment and depletion of the human proteome. (d) Amino-acid frequency analysis of the N-terminal and C-terminal IDRs and the DBHS domain of NONO using a sliding window of 30 amino acids. (e) Amino-acid enrichment and depletion histogram of the N-terminal and C-terminal IDRs and the DBHS domain of PSPC1 mapped against the average enrichment and depletion of the human proteome. (f) Amino-acid frequency analysis of the N-terminal and C-terminal IDRs and the DBHS domain of PSPC1 using a sliding window of 30 amino acids.
Figure 8
Figure 8
A cartoon model emphasizing the behaviour of SFPQ IDRs based on experimental results. (a) SEC-SAXS modelling and XL-MS indicate overlapping conformational space of the N- and C-terminal IDRs, meaning that an interaction between them is possible. (b) An additional shorter SANS P(r) function with a shoulder shows that this interaction is likely to become more pronounced at low salt concentrations. The interaction of the two IDRs is likely to serve to negatively regulate phase separation. The N-terminal IDR can collapse onto itself (c, d) in response to changing salt concentrations. This ‘stickiness’ may be relevant for the recognition of dsDNA, which may occur in a more structured way where the N-terminal IDR folds upon binding dsDNA or for interactions with the nearby C-terminal IDR. (e) The binding of the N-terminal IDR to nucleic acids (long grey bar) would free the C-terminal IDR to drive LLPS. This may act as a trigger that promotes phase separation.
Figure 9
Figure 9
A cartoon summarizing the modulation of phase behaviour through dimer choice and possible mechanisms for disease-associated mutants in the C-terminal IDRs of DBHS proteins. (a) Self-interaction of the IDRs of SFPQ as a means to prevent unintended exaggerated phase separation and the possibility for dimer exchange disrupting interactions between IDRs or forming different ones and modulating LLPS. (b) Droplets made up of different types of dimers with potentially different material properties. (c) Possible mechanism for disease-associated cysteine mutants identified in the C-terminal IDRs of human DBHS proteins. Disulfide bonds could also form directly between IDRs with cysteines in them.

References

    1. Aledo, J. C. (2021). Biomolecules, 11, 1248. - PMC - PubMed
    1. Borcherds, W., Bremer, A., Borgia, M. B. & Mittag, T. (2021). Curr. Opin. Struct. Biol.67, 41–50. - PMC - PubMed
    1. Bremer, A., Farag, M., Borcherds, W. M., Peran, I., Martin, E. W., Pappu, R. V. & Mittag, T. (2022). Nat. Chem.14, 196–207. - PMC - PubMed
    1. Chong, P. A., Vernon, R. M. & Forman-Kay, J. D. (2018). J. Mol. Biol.430, 4650–4665. - PubMed
    1. Combe, C. W., Graham, M., Kolbowski, L., Fischer, L. & Rappsilber, J. (2024). J. Mol. Biol.436, 168656. - PubMed

MeSH terms

Substances

LinkOut - more resources